By: Jeremy Kadlec | Comments | Related: > Dynamic Management Views and Functions
Problem
From SQL Server 2000 to 2005, many of the core SQL Server system metrics have migrated from static commands to dynamic management views and functions that can be queried to gather statistics in real time. The new dynamic management views and functions offer a great deal of flexibility to troubleshoot system issues, especially for WAITSTATS where the the number of milliseconds are captured for threads that are waiting on resources to complete their current batch or query. This information is very valuable to gain an insight into how applications are using SQL Server and the cause and effect of waiting for resources (memory, CPU, disk, etc.). Armed with this information, it should be possible to better tune your applications for greater levels of concurrency and throughput.
Solution
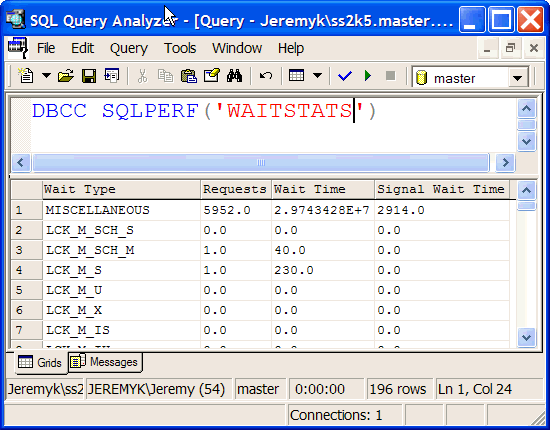
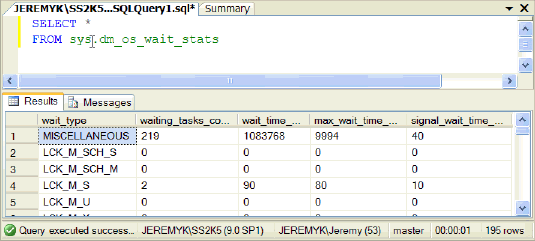
In SQL Server 2000, the command to capture the wait stats was DBCC SQLPERF('WAITSTATS'), although the SQL Server 2000 Books Online documentation always referenced 'LOGSPACE' to assess the current transaction log usage for all databases. In SQL Server 2005, the corresponding dynamic management object is sys.dm_os_wait_stats.
Let's take a look a the examples of each and how they compare.
Example - SQL Server 2000
Example - SQL Server 2005
What are the column mappings between the two commands?
| ID | Description | DBCC SQLPERF('WAITSTATS') SQL Server 2000 |
sys.dm_os_wait_stats SQL Server 2005 |
| 1 | Counter name i.e. 1 of the wait stats that SQL Server captures | Wait Type | wait_type |
| 2 | Count of the wait_type which is incremented by 1 each time the wait_type occurs | Requests | waiting_tasks_count |
| 3 | Total time in milliseconds including the signal_wait_time | Wait Time | wait_time_ms |
| 4 | Maximum wait time for the wait_type | N\A | max_wait_time_ms |
| 5 | Difference between the time the waiting thread was signaled and when it started running in milliseconds | Signal Wait Time | signal_wait_time |
What are the wait types that sys.dm_os_wait_stats captures?
- Latches and locks
- Broker
- Backups
- Transaction logs
- Pages
- Checkpoint and lazy writer
- For a complete listing of the 100+ SQL Server 2005 wait stats visit - sys.dm_os_wait_stats.
Next Steps
- As you begin to review your SQL Server 2000 monitoring scripts and begin to convert them to use the SQL Server 2005 objects and syntax, be sure to include wait stats in your analysis.
- The sys.dm_os_wait_stats DMV is valuable for assessing the performance issues related to a query or batch, so if you are experiencing these types of low level issues or need to pinpoint the problem, spending some time getting to know this table should pay high dividends.
- Click here for a complete listing of the dynamic management views and functions.


About the author
 Jeremy Kadlec is a Co-Founder, Editor and Author at MSSQLTips.com with more than 300 contributions. He is also the CTO @ Edgewood Solutions and a six-time SQL Server MVP. Jeremy brings 20+ years of SQL Server DBA and Developer experience to the community after earning a bachelor's degree from SSU and master's from UMBC.
This author pledges the content of this article is based on professional experience and not AI generated.
View all my tips
