By: Greg Robidoux | Comments | Related: 1 | 2 | 3 | 4 | 5 | 6 | > Query Plans
Problem
One of the primary things that any DBA or developer will do when tuning their SQL statements is to look at the query plan or execution plan. This can be done in both a graphical tree format as well as a text based format. For most people this information is confusing at best and does not explicitly tell you what the issue is and how to fix the problem. For this reason, people have probably become more use to using the graphical plan output versus the text based output.
When troubleshooting a performance problem, the first tool of choice is to either run a server side trace or a trace using Profiler. In addition to getting the query stats it is sometimes helpful to also get the query plan, so you can see if a different plan is being used when the query runs in the application versus running the same query in a query window. When running a trace in SQL Server you have the ability to collect a text based query plan, but unless you are use to reading this output it is difficult to decipher what is going on especially for complex queries. So how can you get useful query plan information in a graphical format when running a trace?
Solution
SQL Server 2005 and later offers the ability to capture query plan information in both a textual format or a graphical format. When setting up your trace you have the ability to capture additional performance type events using SQL 2005 and later Profiler versus SQL 2000 Profiler.
Below is the difference of events that can be captured using SQL Server 2000 versus SQL Server 2005 and later.
SQL 2000 Performance Events
| Event | Event Description |
|---|---|
| Degree of Parallelism (7.0 Insert) | Describes the degree of parallelism assigned to the SQL statement for inserts. |
| Degree of Parallelism (7.0 Update) | Describes the degree of parallelism assigned to the SQL statement for updates. |
| Degree of Parallelism (7.0 Delete) | Describes the degree of parallelism assigned to the SQL statement for deletes. |
| Degree of Parallelism (7.0 Select) | Describes the degree of parallelism assigned to the SQL statement for selects. |
| Execution Plan | Displays the plan tree of the SQL statement being executed. The Showplan Text (Unencoded) event class is the same as the Showplan Text event class, except the event information is formatted as text rather than as binary data. |
| Show Plan All | Displays the query-plan with full compile-time details (including costing estimates and column lists) of the SQL statement being executed. When the Showplan All event class is included in a trace, the BinaryData data column must be selected. If it is not, information for this event class will not be displayed in the trace. |
| Show Plan Statistics | Displays the query-plan with full run-time details (including actual number of rows passing through each operation) of the SQL statement, which was executed. When the Showplan Statistics Profile event class is included in a trace, the BinaryData data column must be selected. If it is not, information for this event class will not be displayed in the trace. |
| Show Plan Text | Displays the query-plan tree of the SQL statement being executed. Include the Showplan Text event class to identify the Showplan operators on SQL Server 2000 or SQL Server 7.0. |
SQL 2005, 2008, 2012, 2014, 2016, 2017 Performance Events
| Event | Event Description |
|---|---|
| Auto Stats | Collects the events associated with the automatic creation and updating of statistics. |
| Degree of Parallelism | Describes the degree of parallelism assigned to the SQL statement. |
| Performance statistics | Indicates that a compiled plan has been cached for the first time, recompiled, or evicted from the plan cache. |
| SQL:FullTextQuery | Displays performance information about individual Full-Text queries, including the query itself, the number of rows returned, and the duration of the query. |
| Showplan All | Displays the query-plan with full compile-time details (including costing estimates and column lists) of the SQL statement being executed. When the Showplan All event class is included in a trace, the BinaryData data column must be selected. If it is not, information for this event class will not be displayed in the trace. |
| Showplan All for Query Compile | Occurs when SQL Server compiles a SQL Statement. Include the Showplan All for Query Compile event class to identify the Showplan operators on SQL Server 2000 or SQL Server 7.0. This event class will also work on SQL Server 2005 or later, however the information included is a subset of the information available in Showplan XML For Query Compile. |
| Showplan Text | Displays the query-plan tree of the SQL statement being executed. Include the Showplan Text event class to identify the Showplan operators on SQL Server 2000 or SQL Server 7.0. This event class will also work on SQL Server 2005 or later, however the information included is a subset of the information available in Showplan All, Showplan XML Statistics Profile or Showplan XML. |
| Showplan Text (Unencoded) | Displays the plan tree of the SQL statement being executed. The Showplan Text (Unencoded) event class is the same as the Showplan Text event class, except the event information is formatted as text rather than as binary data. |
| Showplan XML | Occurs when SQL Server executes a SQL Statement. Include the Showplan XML event class to identify the Showplan operators. The event class stores each event as a well defined XML document. |
| Showplan XML For Query Compile | Occurs when SQL Server compiles a SQL Statement. Include the Showplan XML For Query Compile event class to identify the Showplan operators on SQL Server. |
| Showplan XML Statistics Profile | Occurs when SQL Server executes a SQL Statement. Include the Showplan XML Statististics Profile event class to identify the Showplan operators on SQL Server. |
The events that we are interested in are the Showplan All and Showplan XML. To see the output from each of these events we need to start a new profiler session for a SQL Server database and select these two events:
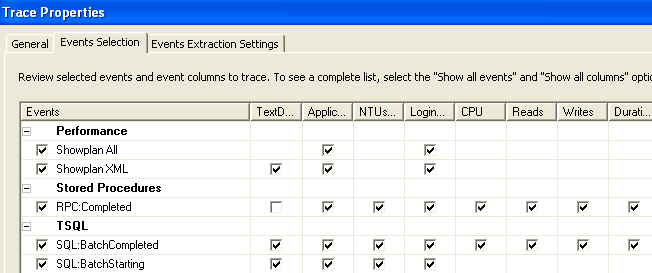
Once these events have been select start the trace.
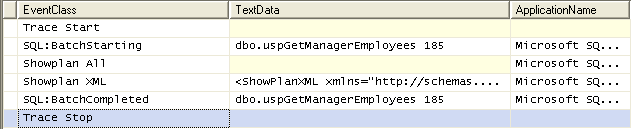
To get an idea of how this works and the output for these two different events we can run the following stored procedure against the AdventureWorks database.
USE AdventureWorks
GO
EXEC dbo.uspGetManagerEmployees 185
After this statement is run, we can stop the trace and we will get the following output from our trace:
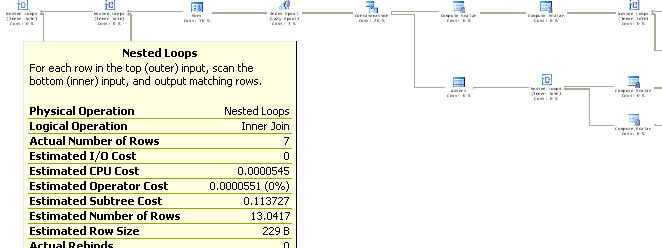
If we take a closer look at the Showplan XML output we get the following graphical query plan for this query. This output works just like the output from a query window, so when you hover over one of the operations it gives you the details for each operation as shown below.
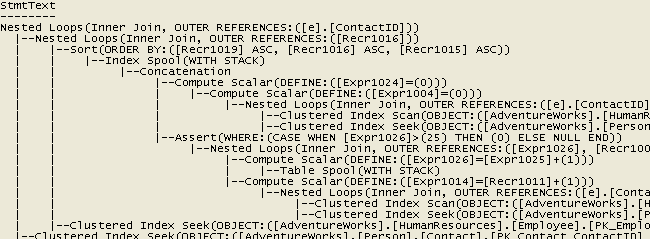
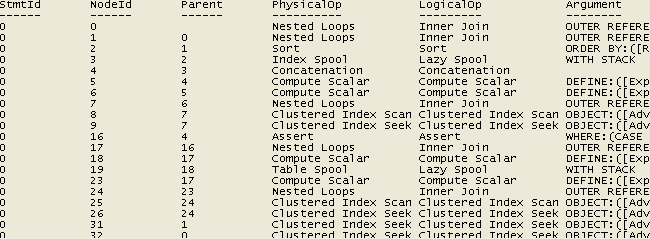
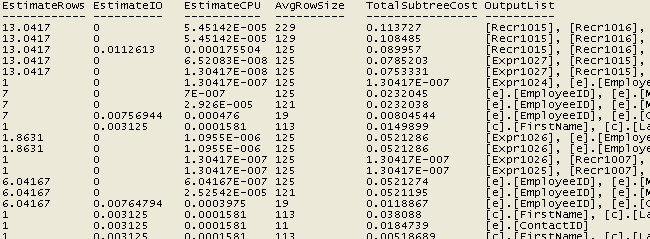
If we take a closer look at the Showplan All output we get a lot more output in a different format. Here are three screenshots from various parts of the output from the Showplan All event.
So as you can see the output from these two events is extremely helpful in trying to troubleshoot a performance problem. For people that are more use to using the graphical output, SQL Server 2005 and later offers both methods of viewing the query plans.
From a first glance you would think this would be a great idea to just turn these events on for all activity. That would be great, but be aware of the space needs to store all of this data. From this simple example above the output files differ quite greatly. For just this one statement here is the difference in file sizes.
- 2K file - No query plan info
- 18K file - Showplan All
- 48K file - Showplan XML
- 64K file - Both Showplan All and Showplan XML
Next Steps
- When troubleshooting a performance problem remember that you have the ability to get query plan information. Now with SQL 2005 and later you can get also graphical plan as well as a text plan.
- When using these options be aware of the space requirements needed to capture and store all of this additional data.
- Try to filter the output based on the columns that are available for the event, so you do not collect too much information
- Take a look at these other tips on setting up and running traces:


About the author
 Greg Robidoux is the President and founder of Edgewood Solutions, a technology services company delivering services and solutions for Microsoft SQL Server. He is also one of the co-founders of MSSQLTips.com. Greg has been working with SQL Server since 1999, has authored numerous database-related articles, and delivered several presentations related to SQL Server. Before SQL Server, he worked on many data platforms such as DB2, Oracle, Sybase, and Informix.
This author pledges the content of this article is based on professional experience and not AI generated.
View all my tips
