By: Greg Robidoux | Comments | Related: 1 | 2 | 3 | 4 | > Performance Tuning
Problem
Both SQL Server and Windows offer a lot of data to help troubleshoot and monitor overall usage and performance for your SQL Server databases. Within SQL Server there are several DBCC commands as well as a lot newly exposed data from the Dynamic Management Views in SQL Server.
One way of monitoring your individual database usage is to view the data from the dbo.sysprocesses table or sys.sysprocesses in SQL Server. This data is also exposed by either using the GUI tools or by running sp_who2. From this you can tell who is currently connected to each database and the activity that is occurring, but it is not very easy to create a baseline or a trend from this data. Another approach is to run a server side trace or use Profiler to capture the data. This may be helpful, but this may give you too much information as well as still having the need to extract the data to figure out what is going on within each database. So what other tools exists to capture database level data?
Solution
Most DBAs and developers probably use Profiler, trace, review query plans, run sp_who2, run DBCCs, etc... to capture data to figure out what is currently running on the database server. These tools are great, but don't give you the entire picture in an easy to use way.
Another tool that all DBAs and developers should use is Performance Monitor. This OS level tool provides great insight into Windows counters, but also into specific SQL Server counters. There are hundreds of counters that are exposed within this tool and there are several that are specific to SQL Server.
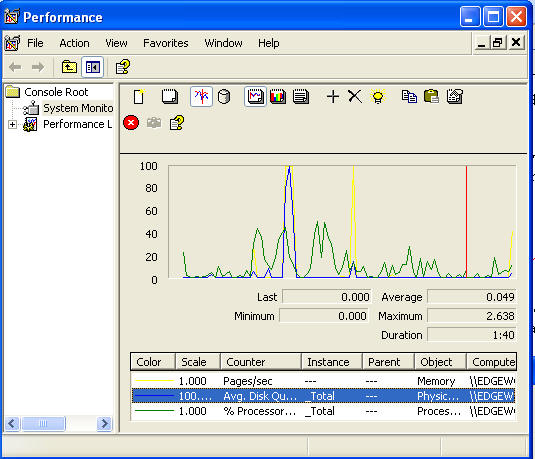
To launch Performance Monitor, click Start, Run... and type in "perfmon" and the following should open. This application can also be found under the Administrative Tools.
To add a counter, click on the + icon or use Ctrl + I and the following will open.
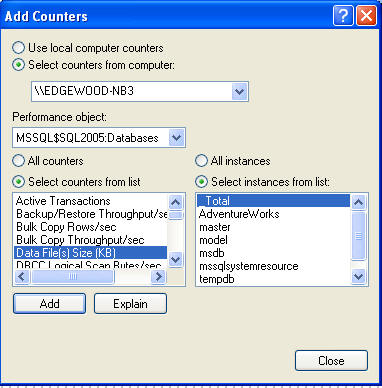
Most of the counters are server specific and do not give you insight into each individual database, but the following list of counters are at the database level, so this means you can collect this data for each database that is on the server as well as an overall count for all databases.
If you navigate to the "Databases" performance objects you can see the counters that are specific to SQL Server databases which are also listed below.
| Counter | Description |
|---|---|
| Active Transactions | Number of active update transactions for the database. |
| Backup/Restore Throughput per/sec | Read/write throughput for backup/restore of a database. |
| Bulk Copy Rows/sec | Number of rows bulk copied. |
| Bulk Copy Throughput/sec | KiloBytes bulk copied. |
| Data File(s) Size (KB) | The cumulative size of all the data files in the database. |
| DBCC Logical Scan Bytes/sec | Logical read scan rate for DBCC commands |
| Log Bytes Flushed/sec | Total number of log bytes flushed. |
| Log Cache Hit Ratio | Percentage of log cache reads that were satisfied from the log cache. |
| Log Cache Reads/sec | Reads performed through the log manager cache. |
| Log File(s) Size (KB) | The cumulative size of all the log files in the database. |
| Log File(s) Used Size (KB) | The cumulative used size of all the log files in the database. |
| Log Flush Wait Time | Total wait time (milliseconds). |
| Log Flush Waits/sec | Number of commits waiting on log flush. |
| Log Flushes/sec | Number of log flushes. |
| Log Growths | Total number of log growths for this database. |
| Log Shrinks | Total number of log shrinks for this database. |
| Log Truncations | Total number of log truncations for this database. |
| Percent Log Used | The percent of space in the log that is in use. |
| Repl Pending Xacts | Number of pending replication transactions in the database. |
| Repl Trans Rate | Replication transaction rate (replicated transactions/sec.). |
| Shrink Data Movement Bytes/sec | The rate data is being moved by Autoshrink, DBCC SHRINKDATABASE or SHRINKFILE. |
| Transactions/sec | Number of transactions started for the database. |
Why is this helpful
Depending on your database server, most SQL Servers host multiple databases and applications. Some of these databases are quite busy and others are not used at all. When deciding to consolidate servers, move databases to another server or moving databases to different physical disks these counters can show you where the bottlenecks may be and also which databases are more busy than others.
Some of the useful database counters to collect are:
- Transactions/sec
- Log Cache Hit Ratio
- Log Cache Reads/sec
- Log Bytes Flushed/sec
- Log Flush Wait Time
- Log Flush Waits/sec
- Log Flushes/sec
- Percent Log Used
By collecting this data for all of your databases you can see where the most activity is occurring. Also, by using Performance Monitor you can easily graph out and trend these various counters for each of your databases. Whether you get this information from running DBCC commands, using the DMVs in SQL 2005 or by using Performance Monitor it doesn't really matter, but these are things that should be reviewed and trended to ensure your databases are running as optimally as possible.
As mentioned already there are a lot of other counters to be used for SQL Server and these should be covered in future tips.
Next Steps
- Start using the counters to collect database specific information
- Begin to baseline and trend your databases for normal activity. Each database is different, so without creating a baseline and trending this data it is hard to say whether there is a problem or not.
- Take a look at these other tips regarding Performance Monitor:


About the author
 Greg Robidoux is the President and founder of Edgewood Solutions, a technology services company delivering services and solutions for Microsoft SQL Server. He is also one of the co-founders of MSSQLTips.com. Greg has been working with SQL Server since 1999, has authored numerous database-related articles, and delivered several presentations related to SQL Server. Before SQL Server, he worked on many data platforms such as DB2, Oracle, Sybase, and Informix.
This author pledges the content of this article is based on professional experience and not AI generated.
View all my tips
