Drill Down Techniques in SSRS with the Visibility Property

By:   |   Comments (29)   |   Related: > Reporting Services Development


Problem

Reporting Services offers many standard solutions out-of-the-box. However, controlling how data is displayed can be frustrating without understanding some of the subtleties of the Reporting Services report designer. Users can get confused and turned off, if the presentation of data is less than perfect. You can create a fairly nice drilldown using the Report Wizard, but how about conditionally opening some groupings and not others? What about starting a drill down report with all the groups expanded? How do you change the behavior of the +/- signs (which is not always intuitive)?

Solution

The solution to these challenges is to understand some subtle techniques when using the Reporting Services report designer. This discussion will demonstration three specific techniques. All of the materials needed for this demonstration are included so you can try this yourself. The techniques are the following:

  • Technique #1 - The Standard "Drilldown"
  • Technique #2 - The Reverse "Drilldown"
  • Technique #3 - Conditional Initial Visibility

Follow along and you'll be a drill down Pro in no time at all.

Sample Data

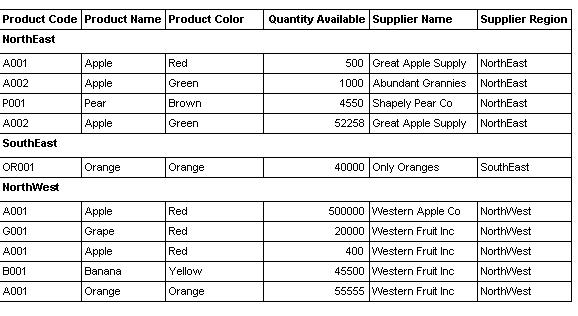
The following examples use a fictitious table about the availability of fruit from different suppliers. If you want to follow along with your own system, create a database called zVisibilityLab. Once created use this script to create the table.

Technique #1 - The Standard "Drilldown"

Setup a new report to use the VISIBILITY_EXAMPLE_TABLE as a datasource. Use the following query:

SELECT ProductCode, ProductName, ProductColor, QuantityAvailable, SupplierName, SupplierRegion
FROM VISIBILITY_EXAMPLE_TABLE

Setup a standard table. When you are done it should look something like this:

setup a standard table in ssrs

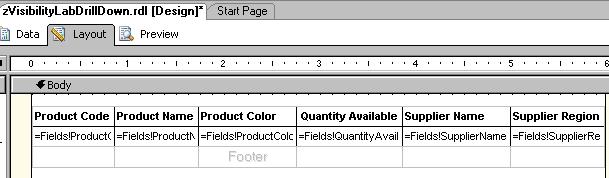
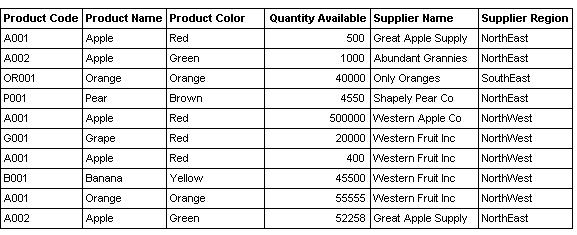
The preview will look like:

the report preview will look like this

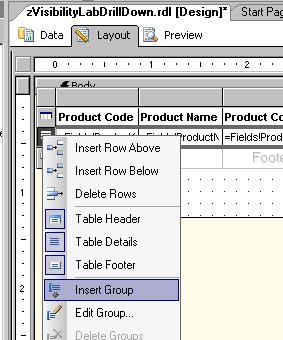
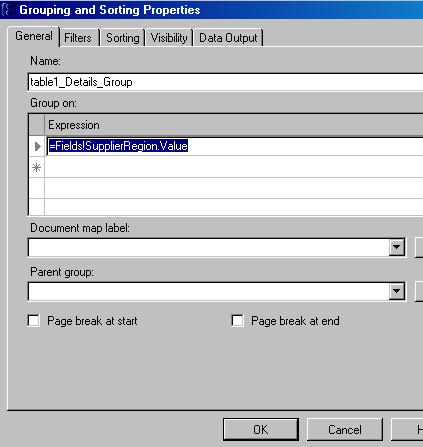
Next add a grouping for Region.

add a grouping to the report in ssrs

Select the Supplier Region field from the dropdown.

write ssrs expression for grouping

I have also merged all cells in the group header, deleted the group footer and added border styles of "solid" for everything. When you are done it may look something like this:

ssrs output with grouping

Now for the Drilldown

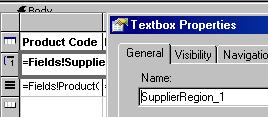
Check the properties of the group header textbox. Note the "Name" property. It should be something like "SupplierRegion_1" (or something close to that).

setup ssrs drilldown in report

Now we have to get to the Details Grouping properties. (There's something about that that doesn't make sense, but go with me here.) There are two ways (that I know of) to get there. 1) Right click on the details line and select Edit Group (even though it's a details line), or 2) select the entire table, right-click, select Properties, then the Groups tab, then Details Grouping. Both these methods bring you to the same place.

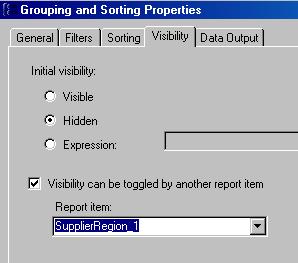
Then click on the Visibility tab. Click Hidden, check the Visibility can be toggled... checkbox and select the SupplierRegion_1 textbox.

toggle visibility setting for grouping and sorting in ssrs

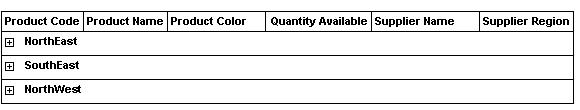
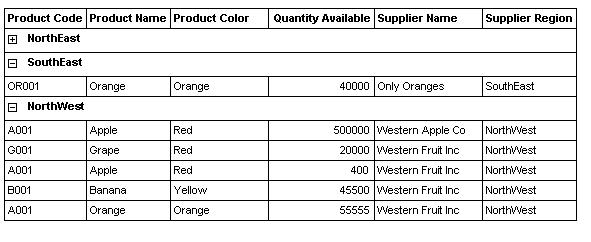
When you are done your preview should look like this:

report will look like this with collapsed rows

Expand some of the times:

expanded rows in ssrs report

Technique #2 - The Reverse "Drilldown"

But let's say this is a small table and you want display the records expanded to open by default. There are two additional things to add to the above technique to make this work.

1) On your Visibility tab (of the Details Grouping), change the Initial Visibility to Visible.

After this, try out a preview. You will notice that the +/- signs do not work the way you would expect or want.

2) To reverse this, right click on the SupplierRegion_1 (group header, not the group details anymore) textbox properties. Select the Visibility tab, then change the Initial appearance of the toggle... to Expanded (-).

expand collapse expression in ssrs

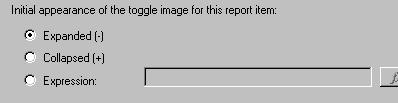
This will correct the +/- sign and you are all set to provide all details by default with the ability to collapse groupings for readability.


Technique #3 -  Conditional Initial Visibility

Now let's say you want to open some groups but not others based on a certain condition. (How about by the number of records?). For the purposes of demonstration, I have added the following expression to the last cell in the group heading line.

=CountRows("table1_Group1")

This will display the number of rows for each group.

Conditional Initial Visibility in ssrs report

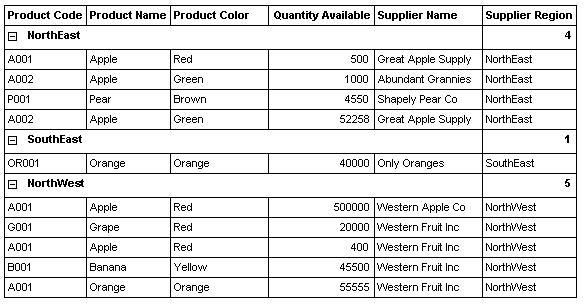
For the sake of this discussion, let's say that we want to display the records of a group only if the number is 4 or less.

In the Visibility tab of the Group Details section, under Initial Visibility instead of  selecting "Visible" or "Hidden",  select  Expression and enter the following in the Expression field (or use the Expression Editor button).

=IIF(CountRows("table1_Group1")<=4,False,True)

*NOTE: Important - Make sure you use the "False" and "True" keywords. In many other cases, the IIF statement uses the keywords from the normal options (i.e. 'solid' &  'none'  for BorderStyle). In this case, you cannot use "hidden" & "visible".

Once done, the report operates fine, but we have to enter a similar (but opposite) expression to fix the +/- signs again. To fix this, right click on the SupplierRegion_1 (group header, not the group details anymore) textbox properties. Select the Visibility tab, then change the Initial appearance of the toggle... to Expression and enter the following:

=IIF(CountRows("table1_Group1")<=4,True,False)

expand and collapse grouping in report

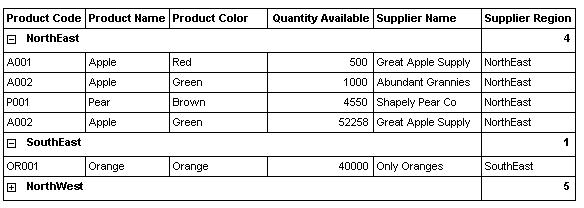
You see, the table conditionally expands where row counts are <=4. You have to click the "+" sign to expand groups of 5 or more.

Next Steps
  • You can use a similar technique (technique #1)  to show and hide columns as needed. For the toggle item, you can use an existing column header (but it can't be one of the hidden ones), or try adding an extra textbox or even an image (i.e. like a button) right above the table.
  • Take a look at these other Reporting Services tips.


sql server categories

sql server webinars

subscribe to mssqltips

sql server tutorials

sql server white papers

next tip


About the author
MSSQLTips author Rob Fisch Rob Fisch has worked with SQL Server since version 6.5 as a dba, developer, report writer and data warehouse designer.

This author pledges the content of this article is based on professional experience and not AI generated.

View all my tips


Comments For This Article


Friday, December 3, 2021 - 4:50:20 PM - BradL Back To Top (89523)
I'm learning SSRS on SQL 2019. Coming from Crystal Reports world that allows extremely robust expressions for just about anything (fonts, visible, color, lines, drilldown, selection criteria, etc). Does SSRS have a "back code" that gives me similar flexibility?

Specifically for this example, I want to have thinner separation lines when the matrix column is expanded, so there's an obvious visual separation from the next column group. Did I miss something?

Tuesday, October 25, 2016 - 8:01:51 AM - Tom Back To Top (43632)

 For those looking for the InitialToggleState in order to perform the reverse drill-down, in SSRS 2012+ it is located in the property pane, not the property page of the designer.  If you try to set it on the textbox itself you will find it locked.  Instead, select the entire grouping row, then in the property pane you should be able to change the InitialToggleState from False to True. 


Friday, September 18, 2015 - 7:58:21 AM - Vivek tripathi Back To Top (38708)

Hi

when i use iff(fields Value, True,False) text Visibility hide but table also hide corresponding that cells whilei want hide only value of text box

rather than table(taxt box with his value)


thanks

vivek tripathi


Wednesday, June 11, 2014 - 10:32:16 AM - sreehari Back To Top (32193)

Hi,


How do i hide and unhide the column based on row toggle... 

My report looks something like this


Category       Product        OrderId     Amount

Bevrages       Cooldrinks    ORD123    120


So if i group on Category and display the Sum of amount, on hide of row product and OrderID will be blank. So in that case when it is + i want ti display Category and Amount and when it is - i want to display all columns


Thursday, November 14, 2013 - 10:08:32 PM - puanani Back To Top (27504)

HI,

I am using SQL 2008 and here is my results after steps 1 and 2.  The following is my output.  I cannot get the #3 item to work.  Can you tell me where the code to fix the +/-?


Monday, September 23, 2013 - 3:23:51 PM - Steve Back To Top (26900)

Rob,

   While you're at it, do you know where I left my car keys?

   (sorry, couldn't resist - I always get a kick out of the random barely-related questions on these public forums)


   Seriously, good article - nicely concise.


Wednesday, August 14, 2013 - 8:53:43 AM - Phyllis Collins Back To Top (26300)

Someone has written a report and it makes a new page for each branch. I know where I would usually go into layout and select new page before or after, but it does not seem to be checked. Are there any other places that could be used to set it to page between? I have been asked to edit the report and take out the page breaks so each branch runs right after the other and not broken out by page. What am I missing?

Thanks for your help


Tuesday, August 13, 2013 - 11:58:09 AM - Bucky Back To Top (26281)

Hi,

Do you know how I can have a toggle item show/hide two or more items in SSRS 2008?  I have a report with three tablix items and the user wants to see one while hiding the other two.


Monday, August 12, 2013 - 12:42:13 PM - Rob Back To Top (26252)


Hi Phyllis

What you want to do is add totals into the header row over your value column and then sort by the =sum(field) in the group 'properties'  

Hope that helps 

Rob


Monday, August 12, 2013 - 8:42:09 AM - Phyllis Collins Back To Top (26245)

Thanks for the wonderful explaination of expand and collapse. I have read many things on it, but this is the first time I actually understood how to do it.

My Question is: What would I need to do to be able to sort the total numbers on the right of the header rows. I would also like to know if there is a way to have a secondary sort. I am currently using version 2005.

Thanks, looking forward to more tips from Rob..


Sunday, June 2, 2013 - 7:57:34 PM - Ned Bakelman Back To Top (25245)


This is awesome. Thank you very much.


Ned


Thursday, December 20, 2012 - 3:29:18 PM - Rob Fisch Back To Top (21067)

Hi Edward,

I know what you mean. To get groups to appear more like SSRS 2005, here's what I do:


  1. Add Group as Parent
  2. Select the entire row, right click, and Insert Row above
  3. Literally copy and paste the new group from the left side to the row directly over the details row (you can reposition and play with adding columns and merging cells later)
  4. then select the entire new (group) column and delete it...right click (Delete Columns).
 
Poof, there you have it....then add (normal) columns, repostion cells and merge as desired.
Have a good holiday.
 
 
-Rob

Thursday, December 20, 2012 - 11:19:41 AM - Edward Back To Top (21059)

Hi Rob;

I don't know if you are still monitoring these comments since there is nothing from you since March of this year.  If you are then I am having a difficulty with an aspect of the report that you did not go into very deeply.  I am working with SSRS 2008 R2.  I am trying to merge cells in the group header.  However, while I can merge cells for most of the data cells in the header, I can't do this with the cell containing the group defining fields.

In addition, the first details row always shows up even when the group is collapsed.  And a column shows up for the group defining field even when I delete it from the tablix form.

If Rob is not monitoring this, could someone else enlighten me on how to fix these issues?


Friday, November 16, 2012 - 4:44:47 PM - Sasi Back To Top (20380)

I am using sql server 2008 R2 and am new to reporting. I am able to create a report as mentioned and able to insert a group with expression as specified. Can someone point me how to merge all cells in the group header?


Thursday, October 18, 2012 - 8:03:02 AM - Dhamodaran S Back To Top (19973)

Format looks very bad while Exporting drill down reports to Microsoft excel. Is there any other way ? or option to export this kind of reports?


Wednesday, July 11, 2012 - 7:09:35 AM - Ranjth Back To Top (18438)

From the post I understand that groupings has been done based on "Supplier Region". I was looking for similar thing with slight modification. I would depict my requirement using the same above example.


At first go the report should look like this


Supplier Region  Quantity Available

-------------------------------------------

+North East         58308

+North West      603455

+South East        40000


Drilling on "North East", data should look like this


Supplier Region  Product Name Quantity Available

-----------------------------------------------------------

-North East        +Apple            53758

                       +Pear              4550

+North West                            603455

+South East                             40000


Drilling on "Apple", data should look like this


Supplier Region            Product Name           Product Color     Quantity Available

-------------------------------------------------------------------------------------------

-North East                  -Apple                     +Red                   500

                                                               +Green                53258

                                 +Pear                                                4550

+North West                                                                        603455

+South East                                                                         40000


Drilling on "Green", data should look like this


Supplier Region                   Product Name                 Product Color             Supplier Name               Quantity Available

-----------------------------------------------------------------------------------------------------------------------------------------

-North East                         -Apple                           +Red                                                             500

                                                                            -Green                       Abundant                       1000

                                                                                                            Green Apple                    52258

                                         +Pear                                                                                                4550

+North West                                                                                                                                603455

+South East                                                                                                                                 40000


Please do let me know if above is achievable using SSRS 2008.


Thanks


Thursday, July 5, 2012 - 2:08:01 AM - Sanjay Back To Top (18350)

From the post I understand that groupings has been done based on "Supplier Region". I was looking for similar thing with slight modification. I would depict my requirement using the same above example.

At first go the report should look like this

Supplier Region  Quantity Available
-------------------------------------------
+North East         58308
+North West      603455
+South East        40000

Drilling on "North East", data should look like this

Supplier Region  Product Name Quantity Available
-----------------------------------------------------------
-North East        +Apple            53758
                       +Pear              4550
+North West                            603455
+South East                             40000

Drilling on "Apple", data should look like this

Supplier Region            Product Name           Product Color     Quantity Available
-------------------------------------------------------------------------------------------
-North East                  -Apple                     +Red                   500
                                                               +Green                53258
                                 +Pear                                                4550
+North West                                                                        603455
+South East                                                                         40000

Drilling on "Green", data should look like this

Supplier Region                   Product Name                 Product Color             Supplier Name               Quantity Available
-----------------------------------------------------------------------------------------------------------------------------------------
-North East                         -Apple                           +Red                                                             500
                                                                            -Green                       Abundant                       1000
                                                                                                            Green Apple                    52258
                                         +Pear                                                                                                4550
+North West                                                                                                                                603455
+South East                                                                                                                                 40000

Please do let me know if above is achievable using SSRS 2008.

Thanks.

Sanjay.


Friday, June 29, 2012 - 9:44:25 AM - Reena Back To Top (18265)

Thank you for posting this!  Great article!  Solved my problem :)


Wednesday, June 20, 2012 - 12:45:59 AM - AbdulRehman Back To Top (18115)

SO easy way to make Group and Collapse View...

THANKS !!~~~


Tuesday, April 3, 2012 - 9:52:44 AM - Valarie Hollars Back To Top (16752)

Can you condtionally ignore that the group was even set up and just display the details while also changing the sort?


BTW article was great!


Val


Thursday, March 8, 2012 - 11:38:55 AM - Rob Fisch Back To Top (16305)

I don't think so, but I am not 100% positive. My recommendation would be to create a separate report for subscription purposes...


Thursday, March 8, 2012 - 10:53:02 AM - Jim Back To Top (16302)

any way to do the conditional toggle if you are doing the report as a subscription?  so when the user goes into SSRS it collapses with the +/- but if we set up a subscription to email them I would like it not collapsed and to get all of the detail


Friday, February 17, 2012 - 2:03:09 PM - laxman Back To Top (16060)
hi how to get each row in one color in ssrs

Friday, January 20, 2012 - 6:59:25 AM - Rob Fisch Back To Top (15712)

Hi Imran,

I believe the same functions exist in 2008, but they are in a different spot. In 2008 you control them from the "Row Groups" section after clicking on the "Advanced Mode" button.

Here's a web page on a different topic, but it illustrates where the new controls are:

http://remicaron.wordpress.com/2010/01/05/how-to-get-ssrs-to-repeat-the-row-headers-tablix-2008/


-Rob


Friday, January 20, 2012 - 6:21:04 AM - Imran Mohammad Back To Top (15711)

Hi,

 Very good article. It worked like a charm in 2005. But we have the same requirement in 2008 and I couln't find the same toggle options for Technique #3. Can You plz suggest how to do this?


Thursday, April 21, 2011 - 11:39:08 AM - Ravi Back To Top (13656)

Very good article. I learn it very easily. Please keep on providing such articles with easy to understand and implement.

Thank you,
Ravi kiran.


Saturday, September 4, 2010 - 12:46:37 AM - Irshad Back To Top (10125)
Hi Jeniffer,

The reverse drilldown in SSRS 2008, is tied to the cell that you are using as the toggle item. As per the example, click on the textbox where the region name is displayed. On the properties, you would notice the InitialToggleState is set to false. Change it to true.

Regards


Tuesday, June 1, 2010 - 10:31:37 AM - sqlboughen Back To Top (5634)

Wow! Thanks! I have been trying to figure out how to do this for months...It's so easy in Crystal, but couldn't figure out how to do in SQL....this is great!!!!


Wednesday, June 3, 2009 - 11:56:20 AM - JENIQ Back To Top (3495)

How do I do The Reverse “Drilldown” in SQL Server 2008 SSRS? I cannot find the same option in 2008.

Thanks,

Jennifer


get free sql tips
agree to terms