By: Greg Robidoux | Comments (3) | Related: > Dynamic Management Views and Functions
Problem
Some tasks that are run in SQL Sever take a long time to run and it is sometimes difficult to tell whether these tasks are progressing or not. One common way of determining that status is to look at the data returned from sp_who2 or sp_lock to ensure that things are still working and the process is not hung. With SQL Server several dynamic management views have been added, so let's take a look at some of these and how they can assist.
Solution
As mentioned above using sp_who2 or using the GUI tools you can get an idea of what is running and the current status of these tasks. With SQL Server several dynamic management views have been added and we will take a look at two of these so you can gain some additional insight into your processing.
The two DMVs that we will look at are:
- dm_exec_requests
- dm_exec_sessions
Data can be selected from these DMVs directly using a SELECT statement.
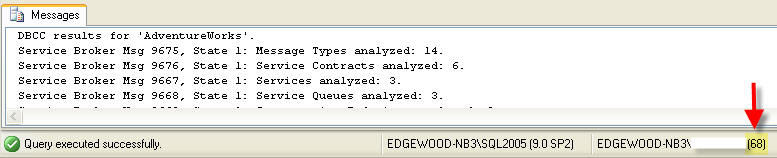
Let's take a look at running a DBCC CHECKDB which often takes a lot of time to process and see what information we get back from sp_who2 as well as these new DMVs. We will run this against the AdventureWorks database.
To do this we open a new query window and then run the following:
use AdventureWorks
GO
DBCC CHECKDB
When looking at the DMVs and the output from sp_who2 we get the results listed below. When I ran this my session_id was 68, so you will need to use the session_id that is being used to run the DBCC command. This can be found on the bottom left of the query window.
SELECT * FROM sys.dm_exec_sessions WHERE session_id = 68
Note: I pivoted the data so it was easier to read.
| session_id | 68 |
| login_time | 9/26/2007 9:16:49 AM |
| host_name | EDGEWOOD-NB3 |
| program_name | Microsoft SQL Server Management Studio - Query |
| host_process_id | 1516 |
| client_version | 5 |
| client_interface_name | .Net SqlClient Data Provider |
| security_id | 0x010500000000000515000000F094C85F782E9D1307E53B2BEB030000 |
| login_name | EDGEWOOD-NB3\DBA |
| nt_domain | EDGEWOOD-NB3 |
| nt_user_name | DBA |
| status | running |
| context_info | 0x |
| cpu_time | 68986 |
| memory_usage | 2 |
| total_scheduled_time | 169019 |
| total_elapsed_time | 214482 |
| endpoint_id | 2 |
| last_request_start_time | 9/26/2007 10:14:56 AM |
| last_request_end_time | 9/26/2007 10:14:46 AM |
| reads | 13870 |
| writes | 278 |
| logical_reads | 367884 |
| is_user_process | 1 |
| text_size | 2147483647 |
| language | us_english |
| date_format | mdy |
| date_first | 7 |
| quoted_identifier | 1 |
| arithabort | 1 |
| ansi_null_dflt_on | 1 |
| ansi_defaults | 0 |
| ansi_warnings | 1 |
| ansi_padding | 1 |
| ansi_nulls | 1 |
| concat_null_yields_null | 1 |
| transaction_isolation_level | 2 |
| lock_timeout | -1 |
| deadlock_priority | 0 |
| row_count | 248 |
| prev_error | 0 |
| original_security_id | 0x010500000000000515000000F094C85F782E9D1307E53B2BEB030000 |
| original_login_name | EDGEWOOD-NB3\DBA |
| last_successful_logon | NULL |
| last_unsuccessful_logon | NULL |
| unsuccessful_logons | NULL |
SELECT * FROM sys.dm_exec_requests WHERE session_id = 68
Note: I pivoted the data so it was easier to read.
| session_id | 68 |
| request_id | 00:00.0 |
| start_time | 14:55.5 |
| status | suspended |
| command | DBCC TABLE CHECK |
| sql_handle | 0x020000002E9F9D2A305AB0BB397742F3F884C999A41E7826 |
| statement_start_offset | 0 |
| statement_end_offset | -1 |
| plan_handle | 0x06000C002E9F9D2AB881CA05000000000000000000000000 |
| database_id | 12 |
| user_id | 1 |
| connection_id | 16A82EE3-CB5F-4977-AF2A-304E5DCB49E1 |
| blocking_session_id | 0 |
| wait_type | CXPACKET |
| wait_time | 4125 |
| last_wait_type | CXPACKET |
| wait_resource | |
| open_transaction_count | 1 |
| open_resultset_count | 00:00.0 |
| transaction_id | 00:00.0 |
| context_info | 0x |
| percent_complete | 84.66557 |
| estimated_completion_time | 1318 |
| cpu_time | 3829 |
| total_elapsed_time | 19627 |
| scheduler_id | 1 |
| task_address | 0x00989018 |
| reads | 1532 |
| writes | 5 |
| logical_reads | 30948 |
| text_size | 2147483647 |
| language | us_english |
| date_format | mdy |
| date_first | 7 |
| quoted_identifier | 1 |
| arithabort | 1 |
| ansi_null_dflt_on | 1 |
| ansi_defaults | 0 |
| ansi_warnings | 1 |
| ansi_padding | 1 |
| ansi_nulls | 1 |
| concat_null_yields_null | 1 |
| transaction_isolation_level | 2 |
| lock_timeout | -1 |
| deadlock_priority | 0 |
| row_count | 248 |
| prev_error | 0 |
| nest_level | 1 |
| granted_query_memory | 2140 |
| executing_managed_code | 0 |
sp_who2 68
Note: I pivoted the data so it was easier to read.
| SPID | 68 | 68 | 68 | 68 | 68 |
| Status | SUSPENDED | RUNNABLE | SUSPENDED | SUSPENDED | SUSPENDED |
| Login | EDGEWOOD-NB3\DBA | ||||
| HostName | EDGEWOOD-NB3 | EDGEWOOD-NB3 | EDGEWOOD-NB3 | EDGEWOOD-NB3 | EDGEWOOD-NB3 |
| BlkBy | . | . | . | . | . |
| DBName | AdventureWorks | AdventureWorks | AdventureWorks | AdventureWorks | AdventureWorks |
| Command | DBCC TABLE CHECK | DBCC TABLE CHECK | DBCC TABLE CHECK | DBCC TABLE CHECK | DBCC TABLE CHECK |
| CPUTime | 72815 | 16 | 47 | 2359 | 2171 |
| DiskIO | 15685 | 0 | 0 | 578 | 648 |
| LastBatch | 9/26/2007 10:14 | 9/26/2007 10:14 | 9/26/2007 10:14 | 9/26/2007 10:14 | 9/26/2007 10:14 |
| ProgramName | Microsoft SQL Server Management Studio - Query | Microsoft SQL Server Management Studio - Query | Microsoft SQL Server Management Studio - Query | Microsoft SQL Server Management Studio - Query | Microsoft SQL Server Management Studio - Query |
| SPID | 68 | 68 | 68 | 68 | 68 |
| REQUESTID | 0 | 0 | 0 | 0 | 0 |
From the above output we can get a handle on the different things that are occurring. The data from sp_who2 is helpful, but it is very limited. The one thing we can see is that the DBCC has spawned multiple threads to run the command, but not a lot more.
One thing to note from the sys.dm_exec_requests is the percent_complete column (this is highlighted above). This gives you an idea where things are as well as an idea that things are progressing as long as this value continues to increase.
Next Steps
- As you can see these two DMVs give you much more insight then sp_who2 gives you. So next time you are monitoring SQL Server , don't forget that these DMVs exist.
- Take a look at these other DMV tips Dynamic Management Views and Functions - SQL Server Exposed


About the author
 Greg Robidoux is the President and founder of Edgewood Solutions, a technology services company delivering services and solutions for Microsoft SQL Server. He is also one of the co-founders of MSSQLTips.com. Greg has been working with SQL Server since 1999, has authored numerous database-related articles, and delivered several presentations related to SQL Server. Before SQL Server, he worked on many data platforms such as DB2, Oracle, Sybase, and Informix.
This author pledges the content of this article is based on professional experience and not AI generated.
View all my tips
