How To Collect Performance Data With TYPEPERF.EXE

By:   |   Comments (19)   |   Related: > Performance Tuning


Problem

As a DBA I like to take advantage of command line tools when I'm working on performance tuning and optimizing my SQL Server databases.  One of the things I typically need to do is to collect performance data on the server which includes CPU, memory and disk utilization as well as SQL Server-specific data.  What command line tools are available to do this?

Solution

TYPEPERF.EXE is a command line tool included with the Windows operating system that writes performance data to the command window or to a file.  It is necessary to capture performance data whenever you are trying to diagnose performance issues on a server.  Performance data provides information on the server's utilization of the processor, memory, and disk, as well as SQL Server-specific performance data. 

The Windows operating system supplies a plethora of performance data in the form of objects which have associated counters.  As an example SQL Server provides the SQLServer:General Statistics object which reports the details on logins, logouts, database connections, etc.  Some objects break out the counters into specific instances.  As an example the SQLServer:Databases object provides details on data file and transaction log file sizes, the percentage of the transaction log in use, active transactions, etc. for each database. You can specify a single database or all databases combined together as the instance.  Unfortunately the term "instance" has a different connotation in SQL Server; i.e. a named instance. 

As is typical with command line tools, there are many options available which allow you to fine-tune how you would like to use the tool.  Open a command prompt and enter TYPEPERF -? and you will see the following output:

Usage:
typeperf { <counter [counter ...]> 
                                | -cf <filename> 
                                | -q [object] 
                                | -qx [object] 
                                } [options]
Parameters:
  <counter [counter ...]>       Performance counters to monitor.
Options:
  -?                            Displays context sensitive help.
  -f <CSV|TSV|BIN|SQL>          Output file format. Default is CSV.
  -cf <filename>                File containing performance counters to
                                monitor, one per line.
  -si <[[hh:]mm:]ss>            Time between samples. Default is 1 second.
  -o <filename>                 Path of output file or SQL database. Default
                                is STDOUT.
  -q [object]                   List installed counters (no instances). To
                                list counters for one object, include the
                                object name, such as Processor.
  -qx [object]                  List installed counters with instances. To
                                list counters for one object, include the
                                object name, such as Processor.
  -sc <samples>                 Number of samples to collect. Default is to
                                sample until CTRL+C.
  -config <filename>            Settings file containing command options.
  -s <computer_name>            Server to monitor if no server is specified
                                in the counter path.
  -y                            Answer yes to all questions without prompting.

The ultimate goal of using TYPEPERF is to capture performance data in a repeatable way; e.g. specify your options in a batch file that you can execute as required.  The default is to display the performance data in the command window; alternatively you can use the -f option to specify a CSV file (comma separated values), TSV file (tab separated values), etc.

To get started let's figure out what performance objects are available then setup TYPEPERF to capture some performance data.  There are two options that you can use to get the list of performance objects on a particular machine:

  • -q [object] lists the installed counters without the instances
  • -qx [object] list the counters including the instances

In both cases [object] is an optional parameter which filters the list to just that object.  The default is to query the performance objects on your current machine; you can include -s <computer name> to specify another machine.  To get the list of counters for the SQL Server Buffer Manager object enter the following command:

TYPEPERF -q "SQLServer:Buffer Manager"

You will see output similar to the following:

\SQLServer:Buffer Manager\Buffer cache hit ratio
\SQLServer:Buffer Manager\Page lookups/sec
\SQLServer:Buffer Manager\Free list stalls/sec
\SQLServer:Buffer Manager\Free pages
\SQLServer:Buffer Manager\Total pages
\SQLServer:Buffer Manager\Target pages
\SQLServer:Buffer Manager\Database pages
\SQLServer:Buffer Manager\Reserved pages
\SQLServer:Buffer Manager\Stolen pages
\SQLServer:Buffer Manager\Lazy writes/sec
\SQLServer:Buffer Manager\Readahead pages/sec
\SQLServer:Buffer Manager\Page reads/sec
\SQLServer:Buffer Manager\Page writes/sec
\SQLServer:Buffer Manager\Checkpoint pages/sec
\SQLServer:Buffer Manager\AWE lookup maps/sec
\SQLServer:Buffer Manager\AWE stolen maps/sec
\SQLServer:Buffer Manager\AWE write maps/sec
\SQLServer:Buffer Manager\AWE unmap calls/sec
\SQLServer:Buffer Manager\AWE unmap pages/sec
\SQLServer:Buffer Manager\Page life expectancy

To get a list of counters with instances enter the following command:

TYPEPERF -qx "SQLServer:Databases" | FIND "tempdb"

You will see output similar to the following:

\SQLServer:Databases(tempdb)\Data File(s) Size (KB)
\SQLServer:Databases(tempdb)\Log File(s) Size (KB)
\SQLServer:Databases(tempdb)\Log File(s) Used Size (KB)
\SQLServer:Databases(tempdb)\Percent Log Used
\SQLServer:Databases(tempdb)\Active Transactions
\SQLServer:Databases(tempdb)\Transactions/sec
\SQLServer:Databases(tempdb)\Repl. Pending Xacts
\SQLServer:Databases(tempdb)\Repl. Trans. Rate
\SQLServer:Databases(tempdb)\Log Cache Reads/sec
\SQLServer:Databases(tempdb)\Log Cache Hit Ratio
\SQLServer:Databases(tempdb)\Bulk Copy Rows/sec
\SQLServer:Databases(tempdb)\Bulk Copy Throughput/sec
\SQLServer:Databases(tempdb)\Backup/Restore Throughput/sec
\SQLServer:Databases(tempdb)\DBCC Logical Scan Bytes/sec
\SQLServer:Databases(tempdb)\Shrink Data Movement Bytes/sec
\SQLServer:Databases(tempdb)\Log Flushes/sec
\SQLServer:Databases(tempdb)\Log Bytes Flushed/sec
\SQLServer:Databases(tempdb)\Log Flush Waits/sec
\SQLServer:Databases(tempdb)\Log Flush Wait Time
\SQLServer:Databases(tempdb)\Log Truncations
\SQLServer:Databases(tempdb)\Log Growths
\SQLServer:Databases(tempdb)\Log Shrinks

Instances in this case (-x option) report the performance counters for the SQLServer:Databases object for each SQL Server database (there is also a _Total instance which combines all databases).  The above output was filtered to include just the tempdb database by piping to the FIND command.    When you are working with a named instance of SQL Server, the performance objects will reflect the SQL Server instance name.  For example I am running an instance of SQL Server 2000 Enterprise Edition which is named SQL2000EE; the performance objects are named MSSQL$SQL2000EE instead of SQLServer as shown above.

Use the -q or -qx options to get the list of performance counters, redirect the list to a text file, then edit the file as necessary to get just the performance counters that you want to capture.  Include the -cf <filename> option on your TYPEPERF command line to get the list of counters to report on from a text file.

Now we are ready to use TYPEPERF to report some performance data.  Here is a sample command:

TYPEPERF -cf MyCounters.txt

The above command will display the counters in the text file MyCounters.txt in the command window every second.  Hit Ctrl-C to cancel.

Here is another example:

TYPEPERF -f CSV -o MyCounters.csv -si 15 -cf MyCounters.txt -sc 60

The above example writes the counter values to MyCounters.csv every 15 seconds.  It stops after writing out the counters 60 times (i.e. 15 minutes).

An example of the output is shown below in Excel 2007: 

excel data

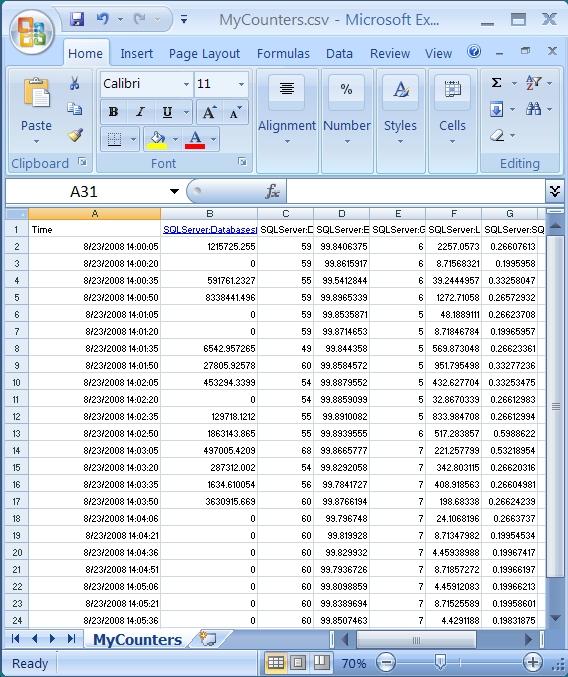
The first row has the counter names; the columns do not show the full counter names just to conserve space.  The list of counters in MyCounters.txt is:

\SQLServer:Databases(_Total)\DBCC Logical Scan Bytes/sec
\SQLServer:Databases(tempdb)\Percent Log Used
\SQLServer:Buffer Manager\Buffer cache hit ratio
\SQLServer:General Statistics\User Connections
\SQLServer:Locks(_Total)\Lock Requests/sec
\SQLServer:SQL Statistics\Batch Requests/sec

In the above screen shot the custom format used for the Time column is m/d/yyyy h:mm:ss.

Next Steps
  • Take a look at our earlier tip Creating SQL Server performance based reports using Excel for some helpful hints on formatting the performance data in Excel.  I used these to format the data in Excel shown above.
  • Add TYPEPERF.EXE to your tool box.  It provides a simple, repeatable way to quickly start capturing performance data.


sql server categories

sql server webinars

subscribe to mssqltips

sql server tutorials

sql server white papers

next tip


About the author
MSSQLTips author Ray Barley Ray Barley is a Principal Architect at IT Resource Partners and a MSSQLTips.com BI Expert.

This author pledges the content of this article is based on professional experience and not AI generated.

View all my tips


Comments For This Article


Tuesday, July 2, 2013 - 5:48:23 AM - Ray Barley Back To Top (25670)

Here is what I found on the TechNet documentation page for TYPEPERF http://technet.microsoft.com/en-us/library/bb490960.aspx

  • Using the -config option

    The contents of the setting file used with the -config option should have the following format:

    [command_option]

    value

    where command_option is a command line option and value specifies its value. For example:

    [-c]

    \Windows\mypath

    [-o]

    report.csv

    [-s]

    mysystem


Monday, July 1, 2013 - 1:51:31 PM - DBA Back To Top (25656)

Hi,

"TYPEPERF -cf d:\MyCounters.txt " this commnad place in MyCounters.config.

c:\window\system32>Typeperf -config MyCounters.config

 it show error

Missing parameter: <counter [counter ...]>

Missing parameter: -cf <filename>

Missing parameter: -q [object]

Missing parameter: -qx [object]


The syntax of the command is incorrect.

   can tell how use config option..

Thanks and regards,

DBA


Monday, July 1, 2013 - 8:13:46 AM - Raymond Barley Back To Top (25645)

What I think you are asking is how to I add another counter to the list that I want to monitor and I'm using the -cf <filename> option to specify the counters I want to monitor in a text file.

Use these commands to see the list of counters that are available:

Counters without instances:

typeperf -q 

Counters with instances:

typeperf -qx


Edit the text file using NOTEPAD and add the counters you want to monitor.  When you use typeperf -q or typeperf -qx the counters are shown in a format like this:

\SQLServer:Databases(tempdb)\Percent Log Used
 
The list of counters you have above doesn't follow this format.

Monday, July 1, 2013 - 7:48:30 AM - SQLDBA Back To Top (25644)

Ok Permission issue sloved.Only i want used i want new counter then what to do ??

1.      SQL Server Up Time

2.      SQL Server Name and Version Detail

3.      SQL Server Name and Installation Detail

4.      SQL Server Server properties

5.      SQL Server Server CPU Information

6.      Server Processor Information

7.      SQL Server SP_CONFIGURE Information For Instance

8.      SQL Server Databases Datafiles location size and status

9.      SQL Server Databases Configuration Properties

10. SQL Server Databases Datafiles Writes/Reads

11. SQL Server Databases Wise CPU Utilization

12. SQL Server Databases Cache Size Information in Buffer Pool

13. SQL Server Instance Wait Type Information

14. SQL Server Signal Wait in Percentage

15. SQL Server Login and session count detail

16. SQL Average Tasks count

17. SQL and OS CPU Utilization from SQL Ring Buffer

18. SQL Memory Utilization History

19. SQL Memory Grant Pending History

20. SQL Memory Clerks Memory Utilization

21. SQL Ad Hoc Query Plan cache Utilization by Top 10

22. SQL Server 2005 TokenAndPermUserStore cache information

23. Monitor the number of entries that are removed in the cache store during the clock hand movement

24. SQL Server enable trace information

25. SQL Server Top 10 SP ordered by Total Worker time

26. SQL Server Scheduler stats and NUMA Stats

27. SQL Server Top 20 SP Executed by Physical Read(IO Pressure)

28. SQL Server Top 10 SP Executed by Logical Read(Memory Pressure)

29. SQL Server Missing Indexes by Index Advantage

30. SQL Server Detected Blocking on Instance

31. SQL Server Database Growth in Last Six Month

32. SQL Server Instance Memory Configuration

33. SQL Server Instance Buffer Pool Usage

34. SQL Server Total Memory Consumption

35. Memory Needed by SQL Server Instance

36. Dynamic Memory Usage for SQL Server Connections

37. Dynamic Memory Usage for SQL Server Locks

38. Dynamic Memory Usage for SQL Server Cache

39. Dynamic Memory Usage for SQL Server Query Optimization

40. Dynamic Memory Usage for Hash sort Index Creation

41. Dynamic Memory Usage by SQL Cursors

42. Bufferpool Pages(Includes Free,Datapage,Stolen)

43. Bufferpool Pages Total Number of DataPages

44. Bufferpool Pages Total Number of FreePages

45. Bufferpool Pages Total Number of Reserved Pages

46. Bufferpool Pages Total Number of Stolen Pages

47. Bufferpool Pages Total Number of Plan Cache Pages

48. SQL Server Binary Module Information

49. SQL Server Version Store Information

50. SQL Server Version Store Information

51. SQL Server Tempdb Usaage by Session

52. SQL Server Top Sessions


Sunday, June 30, 2013 - 5:14:32 PM - Ray Barley Back To Top (25639)

You can find the details on TYPEPERF at http://technet.microsoft.com/en-us/library/cc753182%28v=ws.10%29.aspx  

When you say permission issue if you are talking about the -cf <filename> (text file that has list of counters to monitor) then you will have to create this text file in a location that you can access

If the permission issue is related to the -o <filename> option (output file where counter values are written) then you will have to specify a location that you can write to

Note that you can get the list of counters that are available using the -q [object] and -qx [object] options


Saturday, June 29, 2013 - 1:34:41 PM - sqLDBA Back To Top (25632)

I am using windows 7 so typeerf location was c:\Windows\system32. Thsanks, IT is working but counter  file kept in D:\.C: give permission issue. but i want new counter then what to do ??

1.      SQL Server Up Time

2.      SQL Server Name and Version Detail

3.      SQL Server Name and Installation Detail

4.      SQL Server Server properties

5.      SQL Server Server CPU Information

6.      Server Processor Information

7.      SQL Server SP_CONFIGURE Information For Instance

8.      SQL Server Databases Datafiles location size and status

9.      SQL Server Databases Configuration Properties

10. SQL Server Databases Datafiles Writes/Reads

11. SQL Server Databases Wise CPU Utilization

12. SQL Server Databases Cache Size Information in Buffer Pool

13. SQL Server Instance Wait Type Information

14. SQL Server Signal Wait in Percentage

15. SQL Server Login and session count detail

16. SQL Average Tasks count

17. SQL and OS CPU Utilization from SQL Ring Buffer

18. SQL Memory Utilization History

19. SQL Memory Grant Pending History

20. SQL Memory Clerks Memory Utilization

21. SQL Ad Hoc Query Plan cache Utilization by Top 10

22. SQL Server 2005 TokenAndPermUserStore cache information

23. Monitor the number of entries that are removed in the cache store during the clock hand movement

24. SQL Server enable trace information

25. SQL Server Top 10 SP ordered by Total Worker time

26. SQL Server Scheduler stats and NUMA Stats

27. SQL Server Top 20 SP Executed by Physical Read(IO Pressure)

28. SQL Server Top 10 SP Executed by Logical Read(Memory Pressure)

29. SQL Server Missing Indexes by Index Advantage

30. SQL Server Detected Blocking on Instance

31. SQL Server Database Growth in Last Six Month

32. SQL Server Instance Memory Configuration

33. SQL Server Instance Buffer Pool Usage

34. SQL Server Total Memory Consumption

35. Memory Needed by SQL Server Instance

36. Dynamic Memory Usage for SQL Server Connections

37. Dynamic Memory Usage for SQL Server Locks

38. Dynamic Memory Usage for SQL Server Cache

39. Dynamic Memory Usage for SQL Server Query Optimization

40. Dynamic Memory Usage for Hash sort Index Creation

41. Dynamic Memory Usage by SQL Cursors

42. Bufferpool Pages(Includes Free,Datapage,Stolen)

43. Bufferpool Pages Total Number of DataPages

44. Bufferpool Pages Total Number of FreePages

45. Bufferpool Pages Total Number of Reserved Pages

46. Bufferpool Pages Total Number of Stolen Pages

47. Bufferpool Pages Total Number of Plan Cache Pages

48. SQL Server Binary Module Information

49. SQL Server Version Store Information

50. SQL Server Version Store Information

51. SQL Server Tempdb Usaage by Session

52. SQL Server Top Sessions


Friday, June 28, 2013 - 8:28:48 PM - Ray Barley Back To Top (25627)

Can't say without seeing the contents of MyCounters.txt.  Do you have each counter on a separate line?


Try taking one or more lines out of MyCounters.txt and use it with typeperf and the -q or -qx option and see what happens


Friday, June 28, 2013 - 12:34:29 AM - SQLDBA Back To Top (25608)

hi,

TYPEPERF -q "SQLServer:Buffer Manager" and

TYPEPERF -qx "SQLServer:Databases" | FIND "tempdb" working sucessfully.

But

TYPEPERF -cf MyCounters.txt it show ERROR:Nno valid counters..

How slove this error.


Thursday, May 16, 2013 - 4:12:55 PM - Raymond Barley Back To Top (24001)

I got the idea about running TYPEPERF from c:\windows\syswow64 from this post http://blogs.msdn.com/b/sqlserverfaq/archive/2009/03/18/what-should-we-do-when-the-sql-server-performance-counters-are-missing.aspx (see  Cause 2 which talsk about running perfmon from c:\windows\syswow64)


Thursday, May 16, 2013 - 4:10:47 PM - Raymond Barley Back To Top (24000)

Are you running 32bit sql sERVER ON A 64bit OS?  If so then run TYPEPERF from C:\Windows\SysWOW64


Thursday, May 16, 2013 - 11:23:17 AM - Anandan Kanagarajan Back To Top (23990)

When I try to get the countes by exeucting : TYPEPERF -q "SQLServer:Buffer Manager", the result is 

Error:

The specified object was not found on the computer.

SQL Server 2008 32-bit Default instance is running on Windows Server 2008 R2.

When I enter the counters like on the text file to gather the performance data,


\SQLServer:Buffer Manager\Buffer Cache Hit Ratio


\SQLServer:Buffer Manager\Checkpoint Pages/Sec


\SQLServer:Buffer Manager\Page Life Expectancy


\SQLServer:Buffer Manager\Lazy Writes/Sec


\SQLServer:Memory Manager\Memory Grants Pending


\SQLServer:Memory Manager\Target Server Memory


\SQLServer:Memory Manager\Total Server Memory


 I am getting the error as :Error: No valid counters.


Kindly advise to overcome this issue.


Friday, September 16, 2011 - 1:44:28 PM - Ray Barley Back To Top (14679)

PowerShell has a Get-Counter cmdlet that you can use.  Take a look at this link: http://technet.microsoft.com/en-us/library/dd367892.aspx


Friday, September 16, 2011 - 11:07:20 AM - Mark Back To Top (14677)

*** NOTE


Im curious if there is some way to have only a single value returned.  When I run TypePerf, I get Date stamp in quotes, and perf data in quotes and they are separated with a comma.  I would like to be able to only have the metric returned.  I dont presume there is any secret to being able to accomplish that?? Are there any command line tools that any of you know about that might assist with remote Query of a server, to a perf counter and only return the perf value and nothing else?


Thursday, November 13, 2008 - 9:13:24 AM - GreenAnt Back To Top (2204)

Thanks for the post.  I was having a problem where I couldn't add a new counter log via the mmc, perfmon died with an application error.  I think it's caused by a problem counter but I was able to use typeperf to capture the performance data that I needed.


Thursday, September 4, 2008 - 10:57:13 PM - ALZDBA Back To Top (1742)

the regional settings were indeed my first impression too, so I ran it at the server localy.

The servers have the standard us-english setting.


Thursday, September 4, 2008 - 8:35:48 AM - raybarley Back To Top (1741)

What are your Regional and Language Option settings (under Control Panel)?  Mine are English (United States).  I see you have a comma above when you note that the buffer cache hit ratio should be formatted as 99,85% so I'm just wondering if you have different settings and TYPEPERF isn't respecting that.


Thursday, September 4, 2008 - 8:32:28 AM - raybarley Back To Top (1740)

Here are the contents of the MyCounters.txt file:

HTML clipboard\SQLServer:Databases(_Total)\DBCC Logical Scan Bytes/sec
\SQLServer:Databases(tempdb)\Percent Log Used
\SQLServer:Buffer Manager\Buffer cache hit ratio
\SQLServer:General Statistics\User Connections
\SQLServer:Locks(_Total)\Lock Requests/sec
\SQLServer:SQL Statistics\Batch Requests/sec 

I haven't had any issues with errors yet.

There is a little bit of documentation here: http://technet.microsoft.com/en-us/library/cc753182.aspx If you look at the description for the -cf <filename> option it says: Specifies a file containing a list of performance counters to monitor, with one counter per line. 

That's all there is but it is straight forward; just put one counter per line in the text file.

As far as creating the text file I use the -q and/or -qx options with TYPEPERF to get the list of counters available then edit it as necessary.


Thursday, September 4, 2008 - 2:12:32 AM - ALZDBA Back To Top (1738)

I have my doubts about this tool ....

I tested it on a win2003 / sql2000 server and it provided me data like:
\\myserver\SQLServer:Buffer Manager\Buffer cache hit ratio 99855803893294800
\\myserver\SQLServer:Buffer Manager\Page lookups/sec 78553005279786000

This is offcourse supposed to be 99,85 %, but I hate it when I have to figure out the results myself and need to motify decimal point positions,...


It's a pity, you presented a nice tool, seems like MS messed up a bit.


Wednesday, September 3, 2008 - 10:34:15 AM - MudLuck Back To Top (1734)
Interesting article. If only I would have got this before purchasing Idera'$ SQL diagnostic manager. Well maybe not but I like it none the less and will try it out. A few things I would like to ask. 1. Would you please post the entire contents of the MyCounters.txt file? 2. I assume these counters take the same type of load on the server as if I was running them from the Performance console 3. Is this process prone to locking up with errors like when I run a trace all night come in and it's disconnected? 4. The format file MyCounters.txt where are the rules for setting it up, or how did you learn how to create and customize it? Thanks for the great read I'm doing allot of performance tuning and I believe this will be useful. MudLuck


get free sql tips
agree to terms