By: Arshad Ali | Comments (3) | Related: 1 | 2 | > Debugging
Problem
If you recall your days working with SQL Server 2000, you would remember debugging a routine (Stored Procedure, UDF and trigger) in Query Analyzer, as a debugger tool was available with it. Starting with SQL Server 2005, Query Analyzer and Enterprise Manager had been clubbed together as SQL Server Management Studio (SSMS). Though this single interface has simplified working with SQL Server, one major drawback was, it does not allow you to debug a routine from there. For that purpose you needed Visual Studio (Enterprise and Professional) edition installed, on your development machine, which allowed you to debug a routine. The requirement to install Visual Studio is something that database developers and DBAs would be reluctant to do as it requires additional funds for a Visual Studio license and puts additional pressure on the physical box after installation.
Solution
Debugging capability in SSMS was a long sought feature by users ( http://connect.microsoft.com/SQLServer/feedback/ViewFeedback.aspx?FeedbackID=124550 , http://connect.microsoft.com/SQLServer/feedback/ViewFeedback.aspx?FeedbackID=124613 ) and finally the Microsoft SQL Server team decided to provide this feature in SQL Server 2008. With this feature you can navigate through your code, line by line, watch the current state of variables in the program, an output window where you can observe what the code is doing, error windows, the ability to navigate backward and forward through each line, observe system objects such as the call stack and threads, not only this you can even place "breakpoints" and then tell the debugger to run the code up to that point and then stop.
Example
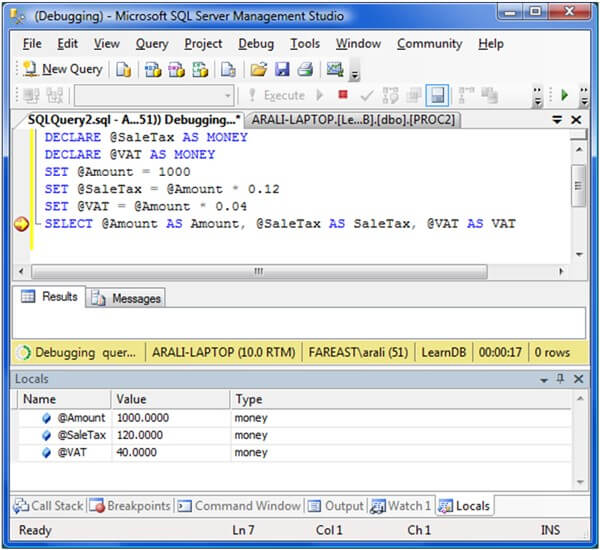
You can start the debugger by either clicking the Debug button on the Query toolbar or by clicking Start Debugging on the Debug menu or pressing ALT+F5.
In the image below I am executing a batch in debug mode; you can notice several windows on the bottom though details of Locals window are only visible which displays information about the local variables in the current scope of the T-SQL debugger.
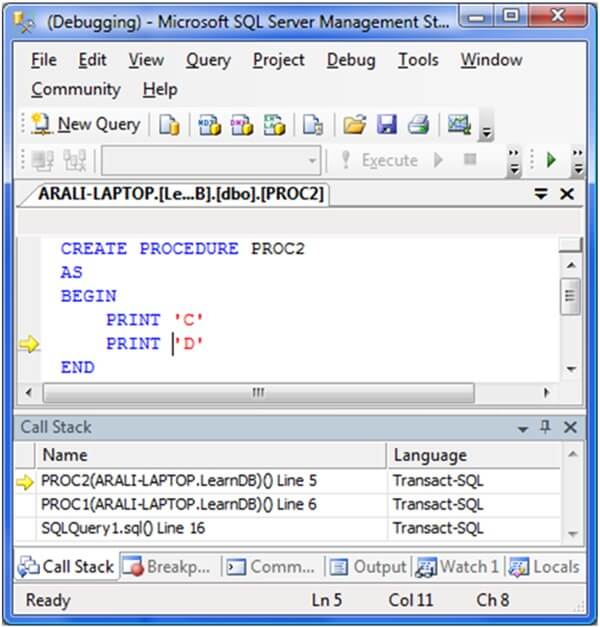
Let's see another example. The script for this is provided in the below table, a procedure calls another procedure, so during execution if you look at the Call Stack window you will get the current execution location, and information about how execution passed from the original editor window through any T-SQL routines (functions, stored procedures, or triggers) to reach the current execution location as shown in the image below.
|
Script #1: Create a procedure which calls another procedure |
CREATE PROCEDURE PROC1 AS BEGIN PRINT 'A' PRINT 'B' EXECUTE PROC2 END GO CREATE PROCEDURE PROC2 AS BEGIN PRINT 'C' PRINT 'D' END GO EXECUTE PROC1 GO |
Note
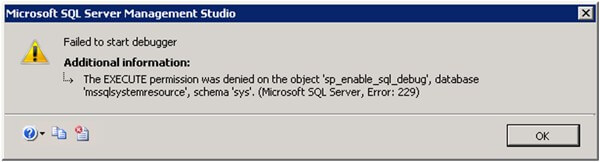
SQL Server Management Studio must be running under a Windows/SQL Server account that is a member of the sysadmin fixed server role or else you will get an error something like this.
If you are running the T-SQL debugger when SQL Server Management Studio is running on a different computer from the instance of the Database Engine, you must enable program and port exceptions by using the Windows Firewall Control Panel application on both computers, for more details click here.
Microsoft recommends that T-SQL code should be debugged on a development/test server and not on a production server because first it requires the member to be part of sysadmin fixed server role to debug and second it may hold resources for longer period while you debug and investigate.
Limitation
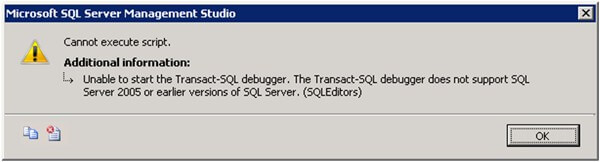
If you are connecting to SQL Server 2005 even from SQL Server 2008 SSMS, you would not be able to debug your routines and get this error, it happens because T-SQL debugger includes both server-side and client-side components. So in a nutshell, it works with SQL Server 2008 only so far.
The T-SQL debugger does not support the Microsoft Visual Studio features of setting breakpoint conditions or hit counts.
Next Steps
-
Review the Debugging SQL Server CLR functions, triggers and stored procedures tip.
-
Review "Using the Transact-SQL Debugger" on MSDN.
-
Happy T-SQL coding and debugging. :)


About the author
 Arshad Ali is a SQL and BI Developer focusing on Data Warehousing projects for Microsoft.
This author pledges the content of this article is based on professional experience and not AI generated.
View all my tips
