By: Ashish Kumar Mehta | Comments (2) | Related: 1 | 2 | > Performance Data Warehouse
Problem
As we are looking through the new features in SQL Server 2008 we found a potentially interesting one called Performance Data Collection and Warehouse feature which we can use to store performance data from multiple SQL Servers Instances within an organization into a single central location. In a previous tip you discussed how to configure this feature in SQL Server 2008. Can you give us a detailed explanation of how to analyze the data which is captured using this feature?
Solution
The Performance Data Collection and Warehouse is a new feature in SQL Server 2008 which can be used by database administrators to gather performance related data using the built-in data collectors which are also known as data collection containers. Using data collectors you can gather performance data from multiple SQL Servers and store it within a Management Data Warehouse (MDW).
Enabling System Data Collection Sets
To start collecting the performance data you need to expand "Management" node in Object Explorer, expand "Data Collection", expand "System Data Collection Sets" and then right click "Disk Usage" and select "Start Data Collection Set" option from the drop down list as shown in the snippet below.
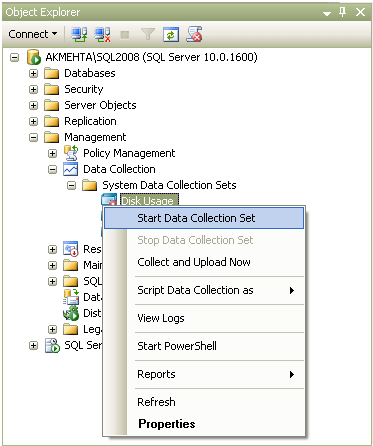
Similarly you need to "Start Data Collection Set" for both "Query Statistics" and "Server Activity".
Reporting Capabilities of Management Data Warehouse (MDW)
Once you have successfully configured the Management Data Warehouse (MDW) with three different Data Collection Sets which are Disk Space, Query Statistics and Server Activity. There are many built in reports which you can use for analysis. These reports are basically created using SQL Server Reporting Services and they can be run from within the SQL Server Management Studio (SSMS). One good thing about these reports is that they will run even if you haven't installed SQL Server 2008 Reporting Services.
Each System Data Collection Set has one parent report which provides a high level overview of data which is stored within the Management Data Warehouse. Let's go through these reports one by one.
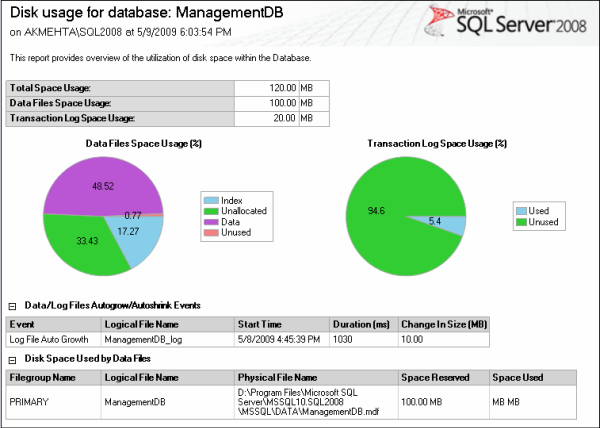
Disk Usage Summary Report
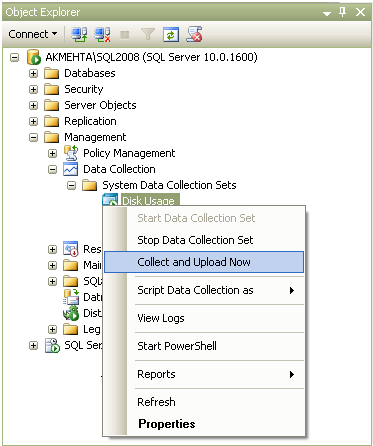
The "Disk Usage Summary" report provides an overview of the disk space used by all the databases on the server and the growth trends for each of the data and log files for each database during the sample interval. Within the ManagementDB database all the necessary tables for a specific report are created the very first time when the collected data is uploaded. You can upload the collected data for "Disk Usage" collection set by expanding the "Management" node in Object Explorer, expand "Data Collection", expand "System Data Collection Sets" and then right click "Disk Usage" and select "Collect and Upload Now" option from the drop down list as shown in the snippet below.
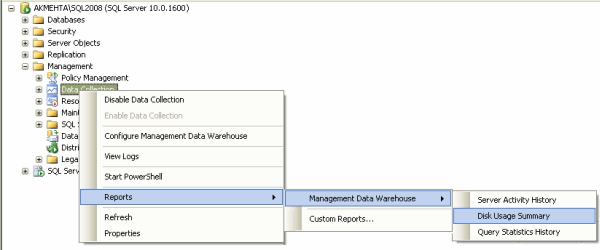
You can view the Disk Usage Report by expanding the "Management" Node and then right click on "Data Collection" and in the drop down list point to "Reports", point to "Management Data Warehouse", and then click on "Disk Usage Summary" as shown in the snippet below.
Using the Disk Usage Summary Report you can quickly identify the growth trend for the data and log files for each database during the sample interval.
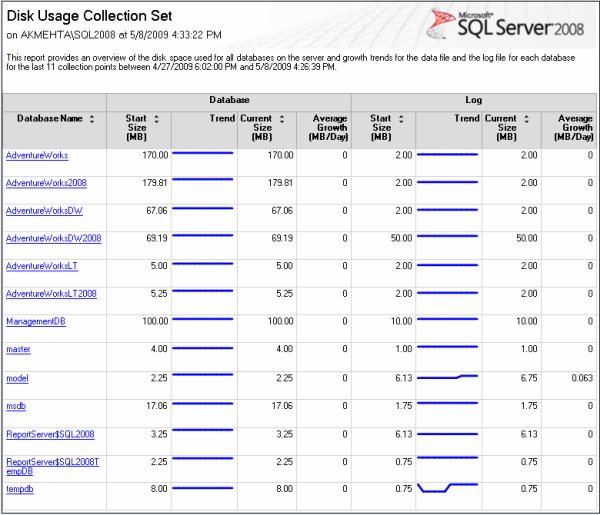
Moreover, if you are interested in knowing more detailed information for a particular database then you can click the database to open up the detailed report for the specific database.
Query Statistics History Report
The Query Statistics History report provides an overview of query execution statistics for the SQL Server instance during the sampled interval. Within the ManagementDB database all the necessary tables for a specific report are created the very first time when the collected data is uploaded. You can upload the collected data for "Query Statistics" by expanding Management node in Object Explorer, expand "Data Collection", expand "System Data Collection Sets" and then right click "Query Statistics" and select "Collect and Upload Now" option from the drop down list.
You can view the Query Statistics History report by expanding "Management" Node and then right click "Data Collection" and in the drop down list point to "Reports", point to "Management Data Warehouse", and then click "Query Statistics History".
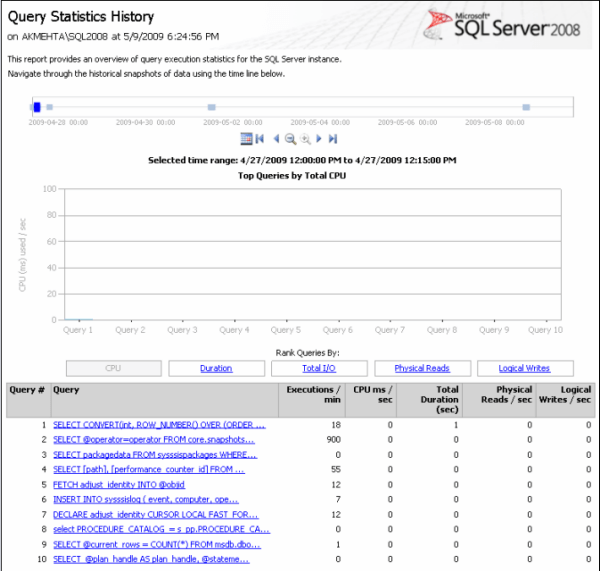
The Query Statistics History report has three different sections. In the top section you can navigate through the historical snapshots of the data using the time line. The second section represents the graphical representation for the resources. The five different types of resource usages are CPU, Duration, Total I/O, Physical Reads and Logical Writes. In the last section you will be able to see top 10 queries based on the resource usage which you selected in the second section. To know more details about the queries resource usage you can click on the hyperlink in the Query column.
Server Activity History Report
The Server Activity History report provides an overview of resource consumption and server activity for the SQL Server instance and for the host operating system during the sampled interval. Within the ManagementDB database all the necessary tables for a specific report are created the very first time when the collected data is uploaded. You can upload the collected data for Server Activity by expanding "Management" node in Object Explorer, expand "Data Collection", expand "System Data Collection Sets" and then right click "Server Activity" and select "Collect and Upload Now" option from the drop down list.
You can view the "Server Activity History" report by expanding "Management" Node and then right click "Data Collection" and in the drop down list point to "Reports", point to "Management Data Warehouse", and then click "Server Activity History".
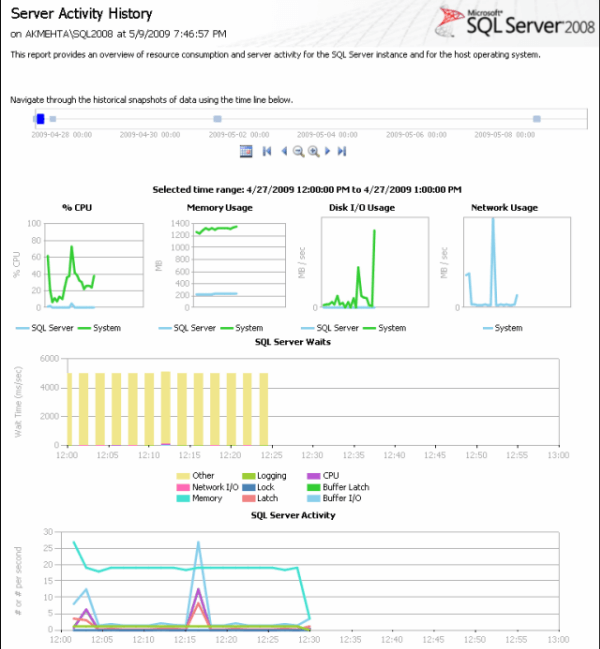
The Server Activity History report displays graphs for CPU Usage, Memory Usage, Disk I/O Usage, Network Usage, SQL Server Waits Statistics and SQL Server Activity. These graphs will help you to identify the resource consumption trend on the SQL Server Instance. You can click on the graphs to drill down and get more detailed information.
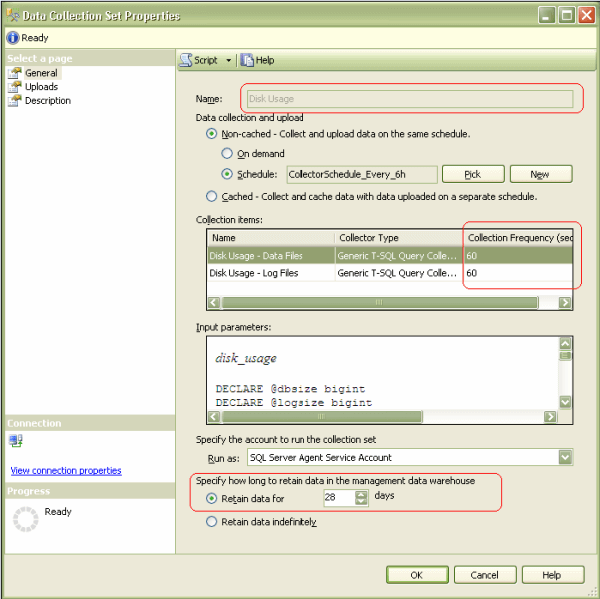
Managing the Data Retention Period in Management Data Warehouse (MDW)
The default Data Retention Period in MDW is 4 weeks. If you want to reduce the data retention period in MDW then you can do this by expanding Management node, expand "Data Collections", expand "System Data Collections Sets" and then right click the particular data collection and select Properties from the drop down list. This will open up Data Collection Set Properties dialog box as shown in the below snippet. Here, you can change the Collection Frequency (sec) value and you can also change the default retention period by altering the value for Retain data for 28 days.
Next Steps
- Download SQL Server 2008 Enterprise 180 Day evaluation from this site.
- Refer the following tip to know more about performance counter "Collecting performance counters and using SQL Server to analyze the data".


About the author
 Ashish Kumar Mehta has been contributing to the MSSQLTips.com community since 2009 with over 60 tips.
This author pledges the content of this article is based on professional experience and not AI generated.
View all my tips
