By: Sadequl Hussain | Comments (3) | Related: > Performance Tuning
Problem
SQL Server DBAs are expected to know some basic Windows Server administration skills. Traditionally, one of the Windows tools DBAs would learn to use is the Performance Monitor. DBAs who knew how to use perfmon in Windows Server 2003 may still find the Reliability and Performance Monitor in Windows Server 2008 a bit of an unknown when they first see it. However, in addition to all the existing features from the previous versions, this applet now offers some new functionality that can make performance troubleshooting a lot easier. In this tip, I will try to give an overview of this tool.
Solution
When you start the Reliability and Performance Monitor applet (from Start > All programs > Administrative Tools), you will see something like the following:
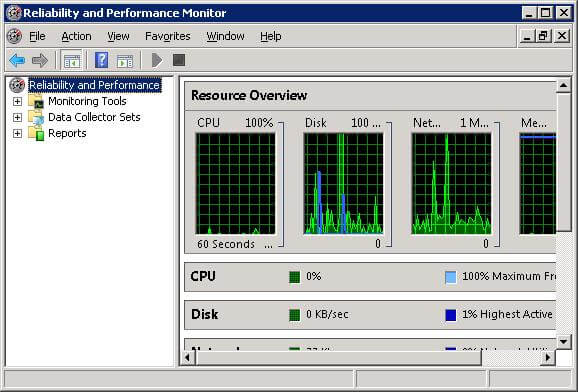
Like most other tools of its class, the user interface is divided into a navigation and a detail pane. The navigation pane divides the application's functionality into four main areas:
- Resource Overview
- Reliability Monitor and System Stability Chart
- Data Collector Sets and Performance Monitoring
- Performance Monitor Reports
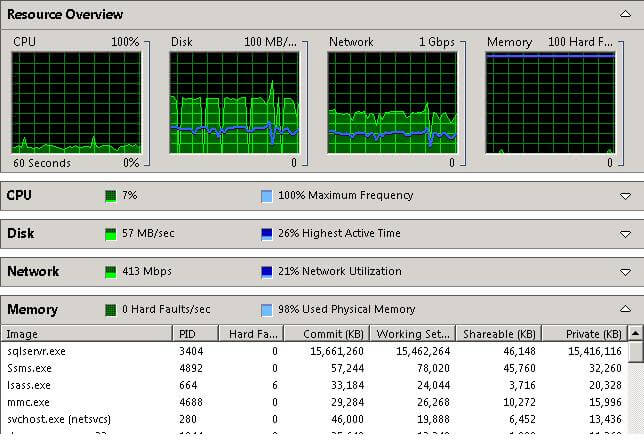
Resource Overview
Perhaps the first thing you would want to look at when troubleshooting a slow performing server is the status of its physical resources. The integrated Resource View screen gives you just that information. The tool shows you the condition of the CPU, disk, network and memory of the local server in real-time. For each of the resource types, the detail section also shows a list of processes running. This can help you identify the process causing the bottleneck.
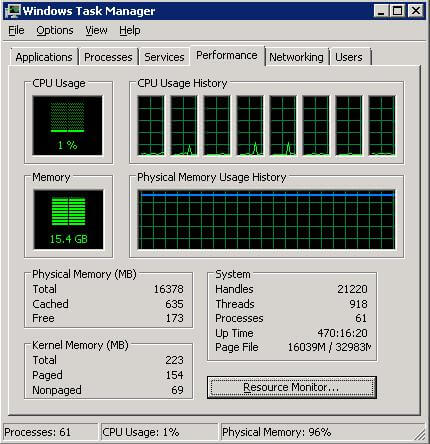
The Resource View is the first screen you see when you start the Reliability and Performance Monitor. You can also start this tool as a standalone applet by either:
- Running the command perfmon /res from the Start menu's Run dialog box or
- Clicking on the Resource Monitor button in the Performance tab of the Task Manager
Reliability Monitor
The Reliability Monitor is another invaluable tool in the System Administrator's arsenal for root cause analysis. As the name suggests, this tool tracks the reliability and stability of the overall Windows system. It does so by continuously collecting system related information in the background, analyzing the data collected and displaying the results in an easy to understand graphical format.
When you look at the Reliability Monitor, you will notice the screen is divided into two parts. The top half of the screen, shown like a graph, is called the System Stability Chart, while the bottom half, divided into five sections, is known as the System Stability Report.
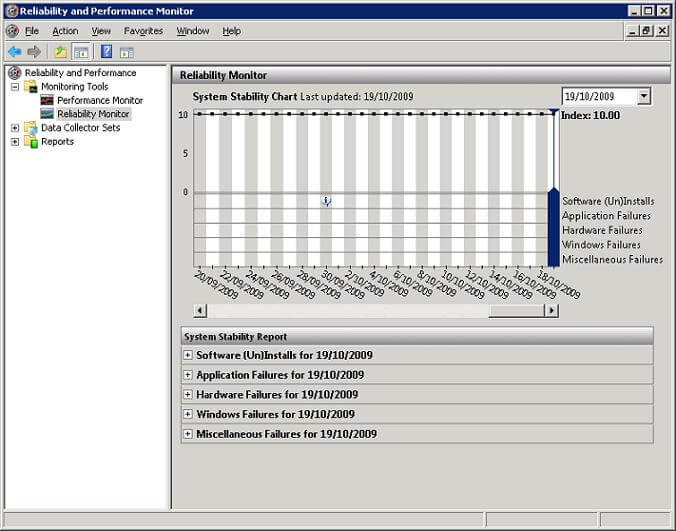
The System Stability Chart shows a graph of the system's Stability Index over a period of time. The stability index is a measure of how "stable" the system is. Reliability Monitor calculates this index by looking at the number of system failures recorded within a rolling period of time and assigning it a relative value from 1 (least stable) to 10 (most stable). The top half of the Reliability Monitor plots this stability index rating for each day as a point in a graph . Just by looking at the Stability Chart, you will have an idea about how good or bad your server has been behaving.
If the system encounters some error condition, it will immediately become evident from the chart. The stability index line chart will have a dip under the optimum value of 10 as shown below: Also an error icon will appear in the column for that date.
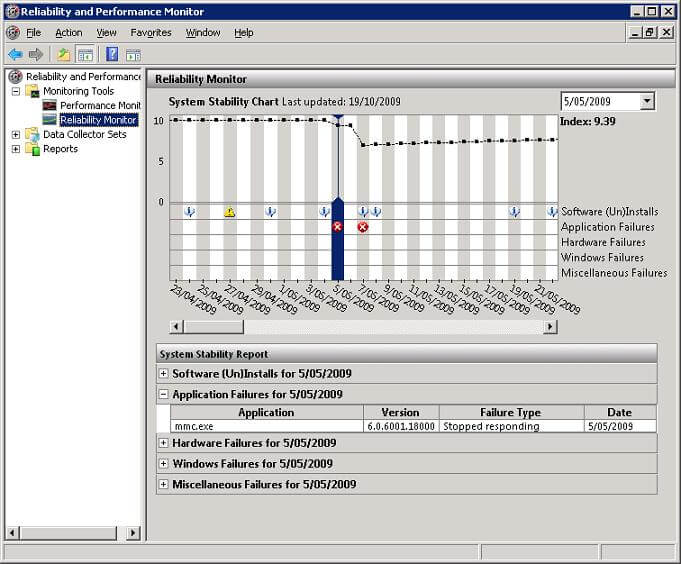
The chart will show an information icon when the system undergoes a successful software installation or removal. If the install or uninstall encounters errors, this will be highlighted by a warning icon (exclamation sign within a yellow triangle). Any other error condition will be marked with a critical sign (cross within a red circle). If you click on any of the columns (representing each date) in the Stability Chart, the Stability Report at the bottom half of the screen will show the system events recorded for that day. As you can see from the figure, a Microsoft Management Console application stopped responding on the 5th of May, bringing down the overall system stability index. Two days later, there was some application installation and again a failure occurred, dropping the index sharply. It took a long time for the system to get back to the normal 10 grade rating.
The Stability Report is tied to the Stability Chart and can show detailed information on the following types of events happening in your Windows Server 2008 system:
- Software (Un)Installs: Errors related to Windows components or third party application setup and removal
- Application Failures: Unexpected program crashes, hangs etc.
- Hardware Failures: RAM failures (e.g. faulty chips) or disk crashes
- Windows Failures: Any errors during server boot up
- Miscellaneous Failures: Any other error condition
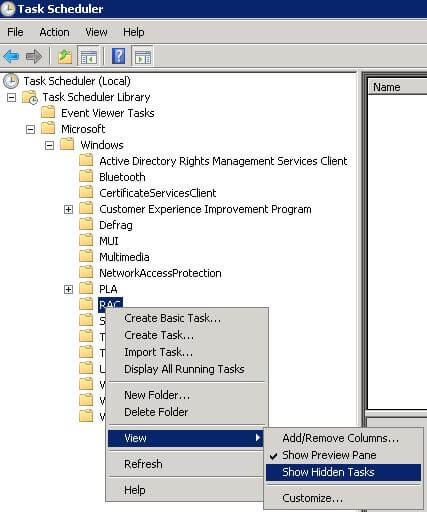
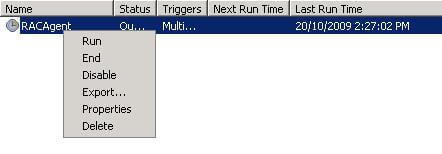
The way Reliability Monitor traps these events is by running a hidden background scheduled task called the RACAgent. RACAgent is really RACAgent.exe located under System32 folder of the Windows installation directory. Windows saves the data collected by this process in locally managed files. Usually the process starts right after the Windows software has been installed, but if it is turned off for any reason, the Reliability Monitor will not have enough data to work with. When there is not enough information, the stability chart will be shown as a dotted line instead of a solid one. If you suspect the RACAgent has not been running, you can follow these steps:
- Start the Windows Server 2008 Task Scheduler (Start > All Programs > Accessories > System Tools > Task Scheduler)
- Expand Task Scheduler Library. Expand Microsoft, then Expand Windows
- Right Click on RAC, Choose View > Show Hidden Tasks
- The detail pane of the task scheduler will show an entry for the RACAgent. You can right click on the RACAgent and choose any of the Options (Run / Enable / Disable/ Start / Stop) from the pop-up menu.
If you want to start the Reliability Monitor as a standalone applet rather than accessing it through the Reliability and Performance Monitoring tool, you can execute the perfmon /rel command from the Start menu's Run dialog box:
The final thing you should probably know about the Reliability Monitor is that you can use it to check the stability of other Windows Server 2008 systems in your network. For Reliability Monitor to be able to connect to a remote server, two things need to be in place:
- The remote computer needs to have its Remote Registry service enabled
- The account you are using to log on is a member of the local Administrator group in the remote computer.
If both the options are not satisfied, you can get an error message like the following:
"Reliability Monitor cannot report reliability information for computer
or something like:
"When attempting to connect to the remote computer, the following system errors occurred: No such interface supported."
If you have ensured both the conditions are okay, you can right click on the top node in the navigation pane (shown as "Reliability and Performance") and choose "Connect to another computer" from the pop-up menu. This is much like what is available in Windows Server 2003's Computer Management tool or the Services applet.
Data Collector Sets and Performance Monitoring
Data Collector Sets are central to the Reliability and Performance Monitor's functionality. These are nothing but groups of counters and traces that you can package as one single unit. What makes Data Collector Sets special is their reusability and portability.
Think about this scenario: you are the DBA of your organization - you are trying to create performance baselines for your servers. You create two sets of counter logs - each with the same set of performance counters; one is to be run during peak usage and the other during normal load. You can schedule the logs, specify their maximum size and the format of the output files. However, when you need to rollout the same set of counters in another SQL Server for baselining, there is no easy way to port them - chances are, you will have to recreate the logs in the new server, making it a time consuming process.
This is where Data Collector Sets become handy. In a Windows Server 2008 system, you can define your own Data Collector Sets by picking and choosing performance counters. You can then save it as an independent component. When needed, you can export this collector set as a template which saves it as an XML file. You can then import this template in another server and create a new Data Collector Set based on that template. Windows Server 2008 itself ships with three basic templates that can get you started in preliminary performance monitoring.
It's not only the performance counters that are available in the new version. Data Collector Sets now allow you to capture Event Trace data and System Configuration data as well. The first type of collectors, called Event Traces, help you capture low level trace information generated by various applications and the Windows operating system. If you want to capture the changes to a certain registry key, you can specify it under System Configuration.
Just like before, you can define a schedule for the collector set, specify when the data collection needs to stop or what will be the name of the log file. You can separately view the generated log reports for different dates. And also, just like before, you can define alert thresholds and response actions.
The whole process is Wizard driven and we will now see how this works. In the following steps, we will create a Data Collector Set with some basic counters, define a schedule for it and specify the condition for its duration. We will then run it for some time and then view the report. Finally, we will save the collector set as a template.
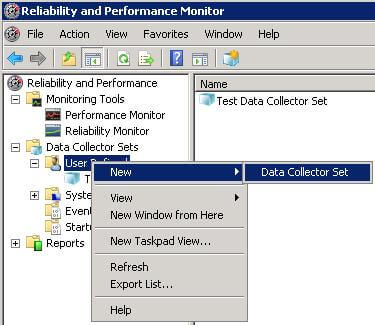
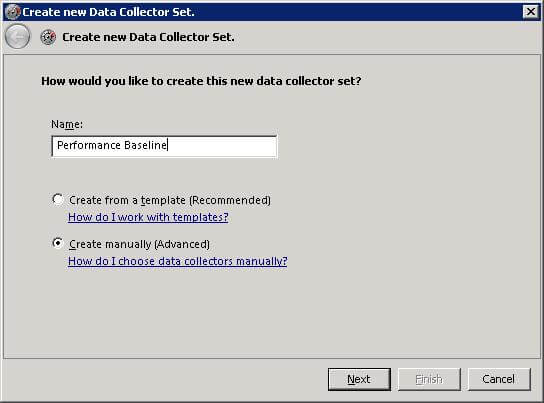
- Start the Windows Reliability and Performance Monitor applet. From navigation pane, expand the Data Collector Sets node, right click on the User Defined node and choose New > Data Collector Set from the pop-up menu.
- The new Data Collector Set Wizard starts. Provide a name and choose the second option "Create manually (Advanced)"
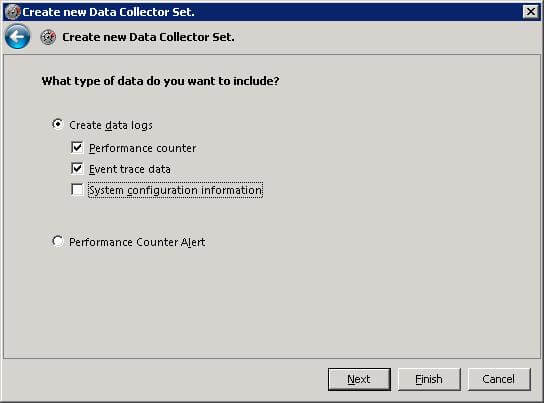
- In the next screen, choose the first option (Create data logs). Select the two checkboxes below it (Performance counter and Event trace data). If you want to configure alerts and responses based on performance conditions, you will need to choose the second option.
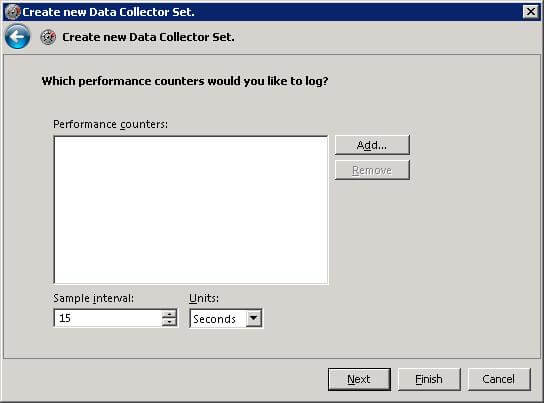
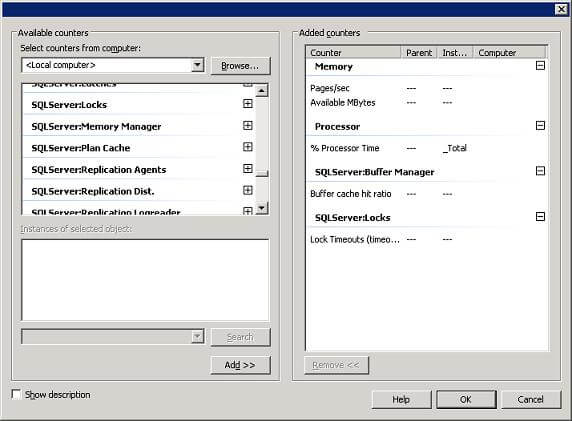
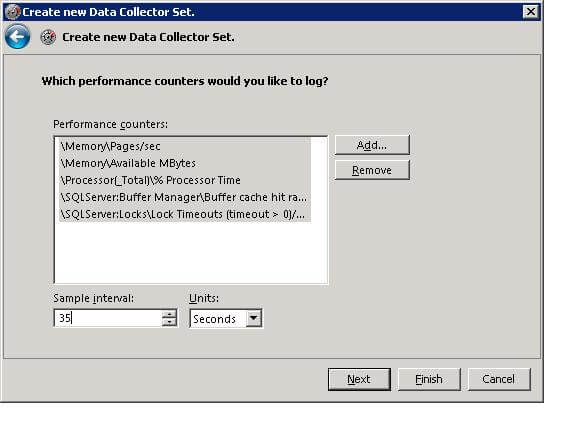
- Next, click "Add..." in the following screen and add some performance counters. For the sake of simplicity, we have chosen only five counters.
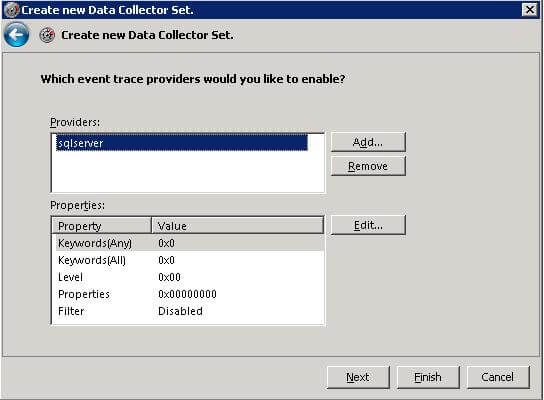
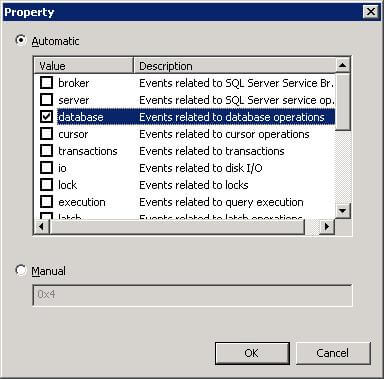
- In the next screen, choose sqlserver as the trace provider. Clicking the "Edit..." button will allow you to narrow down on certain types of events for this trace provider. Choose the event related to database operations.
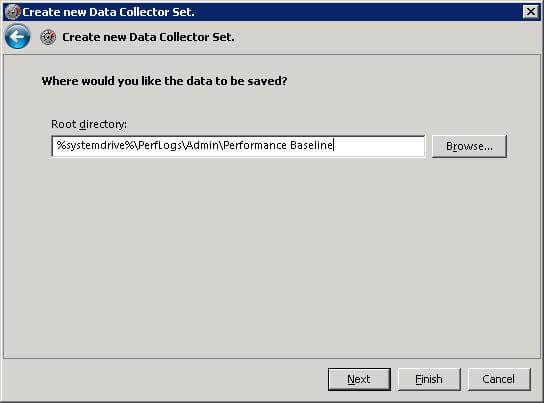
- Next, specify where you want to save the data collector logs. It's best to keep the default settings.
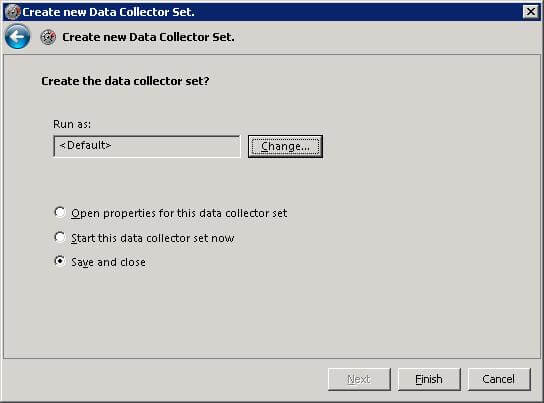
- Data Collector Sets run under the System user by default. It is best that you leave this option in the next screen. Also, you can choose to save and close the Wizard, modify its properties or start running it. For now, just save and close it.
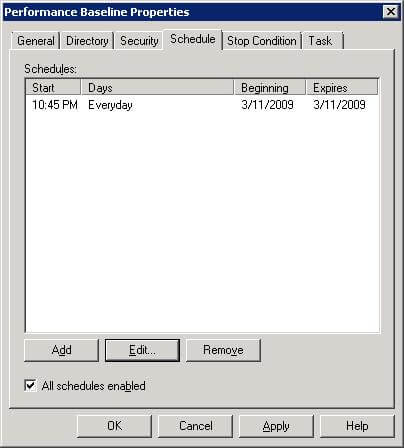
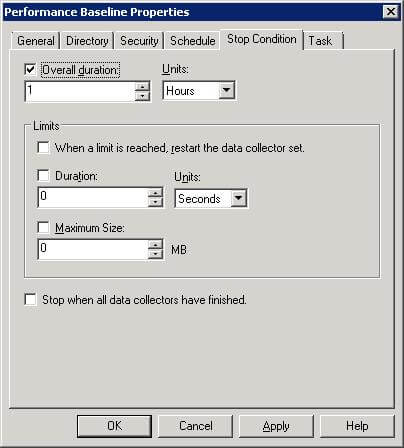
- You will notice that the new Data Collector Set called "Performance Baseline" now appears in the navigation pane under the "User Defined" node. You can right click on the collector set from the detail pane and look at its properties and make changes if necessary. Here, we have defined a schedule for the Data Collector Set from its properties and also provided a stop condition for it.
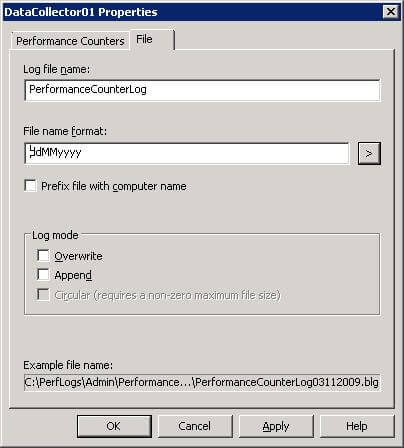
- Data collectors will create individual log files in the system as they monitor. You can specify the properties for these log files. Clicking on the Data Collector Set you just created in the navigation pane will show the individual data collectors in the detail pane (in this case, the collectors will have the generic names of DataCollector01 and DataCollector02 respectively). We have changed their properties as shown below.
- If you have not created a schedule for your Data Collector Set, you can run the it manually by right clicking on it and choosing "Start" from the pop-up menu. In our example here, we have let it run on its schedule for one hour.
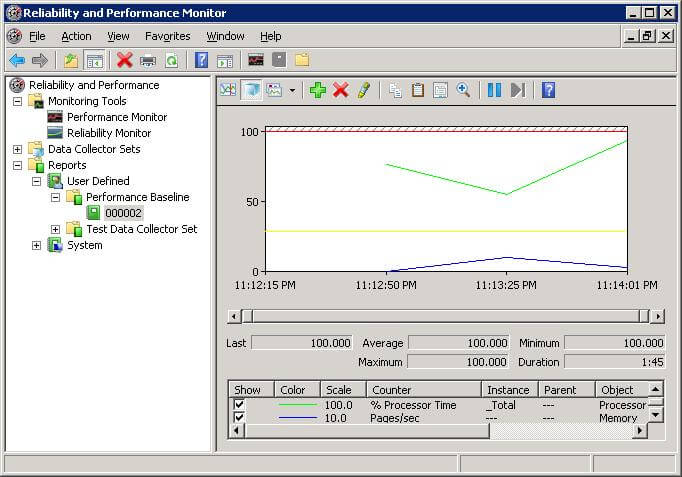
After the collection process completes, we can view the log from the Reports node in the navigation pane. If you expand the Reports node, you will see all your Data Collector Sets listed there. Underneath each set, you will find the reports for each day when the collector set was run. In our example, we will see something like the following:
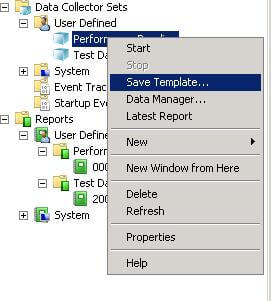
To save the collector set you just defined as a template, right click on it from the navigation pane and choose "Save Template" from the pop-up menu, as shown below. The template will be saved as an XML file.
You can now copy the template to another Windows Server 2008 system and start creating your Data Collector Set based on that template. In such case, you will have to choose the option "Create from a template" in the first screen of the Wizard.
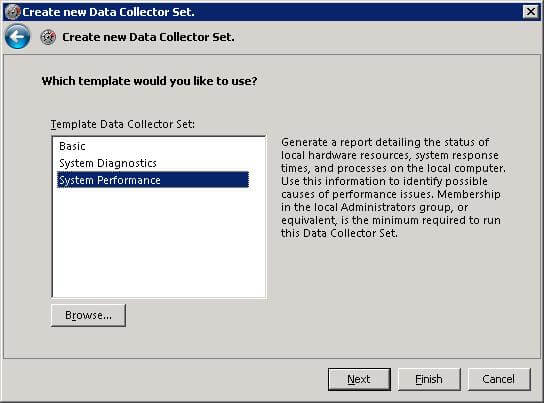
In my opinion, DBAs should start building their Data Collector Sets with the system supplied template called "System Performance". It incorporates a comprehensive range of performance counters and some key events from the Windows kernel trace provider.
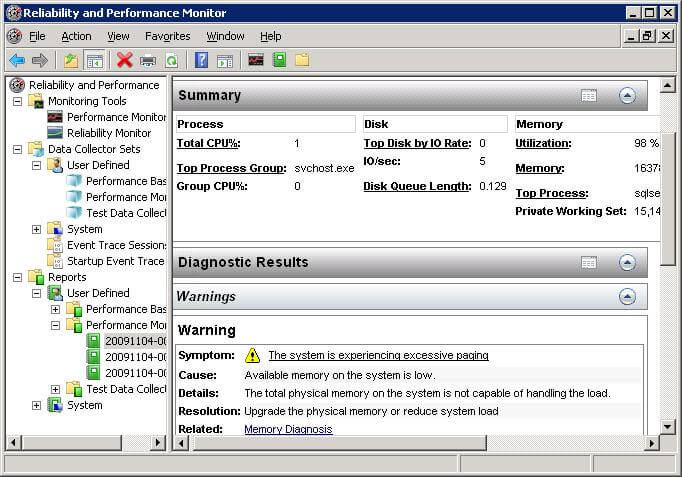
By default the collector set does not come with any schedules attached to it. If you run it, it will execute for one minute. This can be useful if you are trying to get a bird's eye view of your server's performance. The report for the System Performance type Data Collector Set can be quite comprehensive, as shown below.
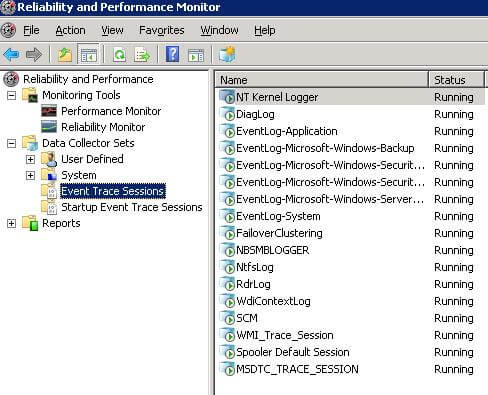
There are also a number of system level Data Collector Sets running at any one time. These collectors mainly capture Windows trace events. It may be worthwhile to have a look at their properties.
Next Steps
- Practice more with the Reliability and Performance Monitor. Learn how to make use of its various components
- Familiarize yourself with SQL Server 2008 Activity Monitor
- Learn about SQL Server 2008 Data Collection and Management Data Warehouse


About the author
 Sadequl Hussain has been working with SQL Server since version 6.5 and his life as a DBA has seen him managing mission critical systems.
This author pledges the content of this article is based on professional experience and not AI generated.
View all my tips
