By: Bru Medishetty | Comments | Related: > Profiler and Trace
Problem
I am a SQL Server user and in my day-to-day work I use SQL Profiler for various purposes. Sometimes I run profiler to trace slow running queries and tune them appropriately; sometimes I run a trace to know details about failed Logins in addition to those reported in SQL Server error log. There are other scenarios such as tracing missing statistics on the tables, finding deadlock information or viewing execution plans of the queries being run and so on.
Every time I start a new trace, I repeat the same steps, such as choosing certain events only and filtering events related a particular database and / or monitor a particular SQL Login and then make the necessary analysis. Choosing these properties each time I start a new trace is tedious and time consuming, is there a way where I can save these settings/ properties of these traces and reuse it next time I need it?
Solution
SQL Server profiler provides trace templates to create templates of those traces which are frequently used and are customized; this is in addition to the existing set of templates.
Let's take a look at creating a Profiler trace template.
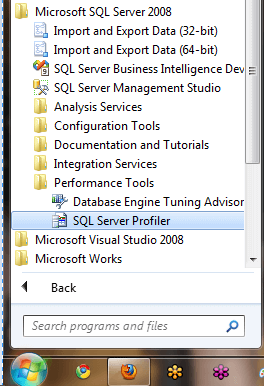
From the start menu go to all programs, under SQL Server 2008 program menu(this can be 2005, depending on the SQL Server you have installed) go to the Performance Tools sub menu, under that, choose SQL Server Profiler (pictured below).
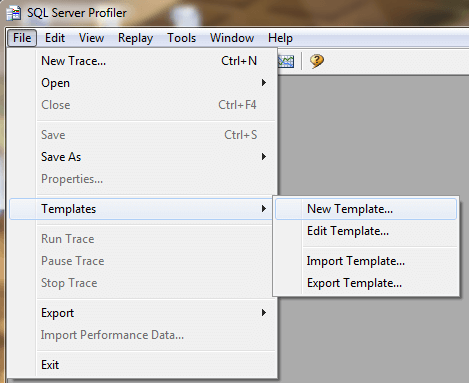
A blank SQL Server Profiler window is opened. As shown in the picture below, from the menu bar choose File -> Templates -> New Template.
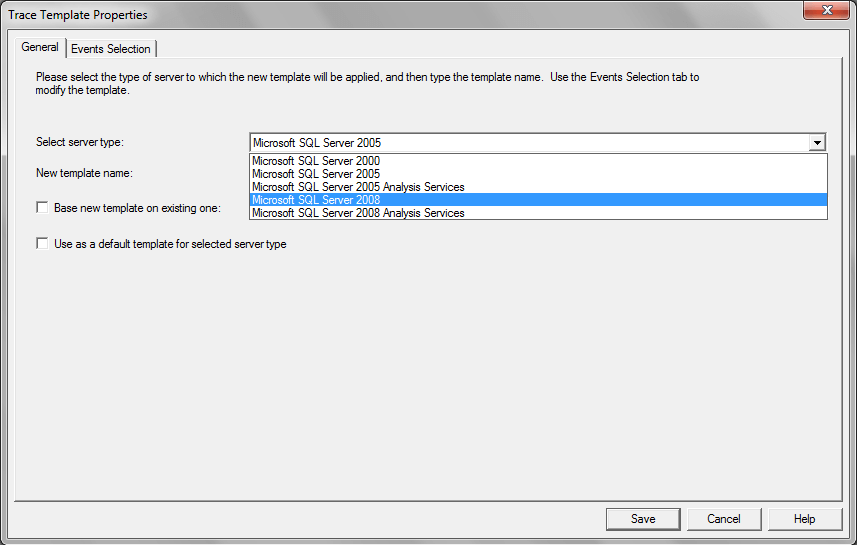
Trace Template Properties dialog box is displayed, in which you can select the server type based on which our new template is being created. Note that the server type available in the drop down list depends on the SQL Server version installed on the machine where you are creating the new trace template. What this means, if you are creating the new trace template on your workstation which has SQL Server 2005 installed then the select server type would not display SQL Server 2008 in the list. The workstation where I am currently creating has SQL Server 2008 installed, hence in the drop down list (picture below) you see 2 items related to SQL Server 2008.
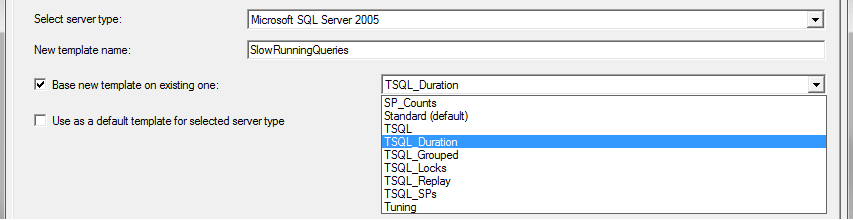
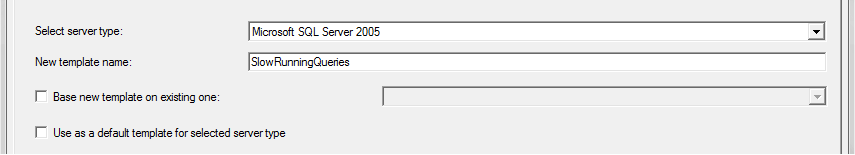
Once the server type is selected, type a name with which you would like to create the new template. Having an appropriate template name to the template would be easier to remember when using the template at a later time. I am choosing SQL Server 2005 as server type and the template name as "SlowRunningQueries". We can create our new template based on one of the existing templates by selecting the check box "Base new template on existing one" (picture below).
Though we are going to create a template from scratch, I wanted to show the above option for users to know an additional point.
Since our template will not be based on existing template, I uncheck the option and continue. The image below is how the dialog box looks like now.
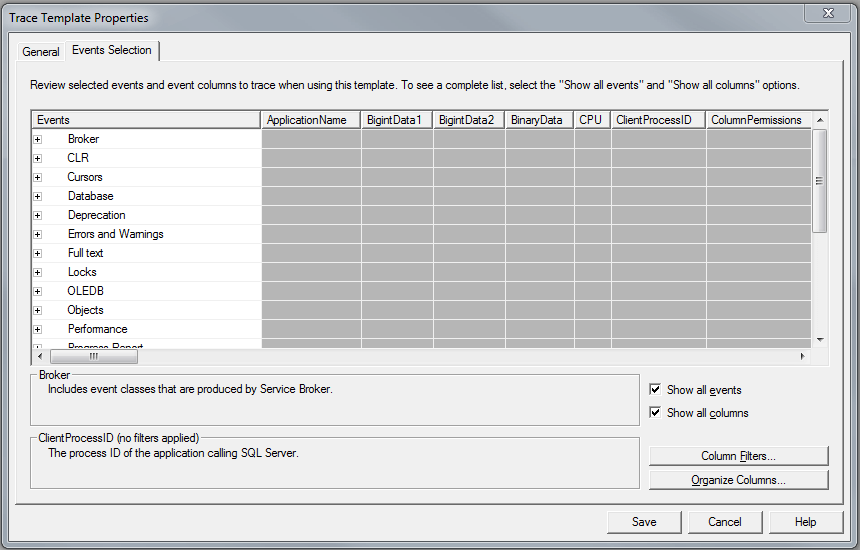
To continue creating the template, choose the "Events Selection" tab on top left of the dialog box. You will find a list of event categories to choose from, a template can have events from more than one category. For simplicity purposes, we are going to create a template based on events from a single category. The below image is how it looks when you select Events Selection tab.
Since we are trying to trace slow running queries, I am going to the TSQL category and expanding that category by clicking on the expand (+) symbol besides the category name, choose 2 events SQL:StmtStarting and SQL:StmtCompleted, by choosing the check marks besides them (picture below).
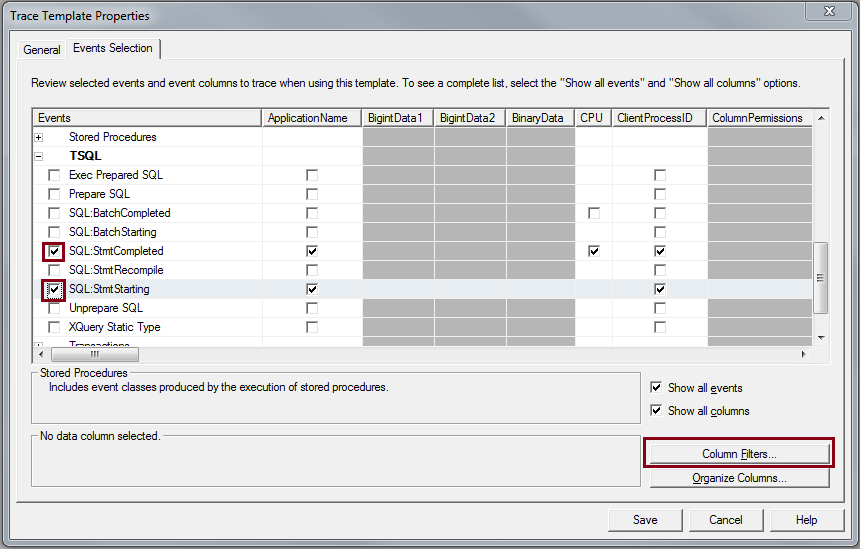
After choosing the events click on "Column Filters..." button. This is where a trace template that is being created can be customized to meet your requirements such as reducing the scope of the events to be traced. In this example I would be including only one database which may be the most critical with respect to performance, so that when I run this trace, I only get trace information pertaining to this database.
When you click on "Column Filters..." button, a new dialog box is displayed where the columns list is displayed, choose DatabaseName and in the right side pane expand the tree view list and enter the database name which is going to tracked for slow running queries.
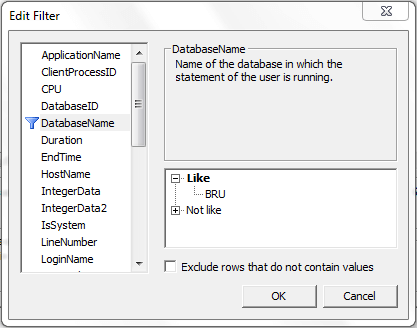
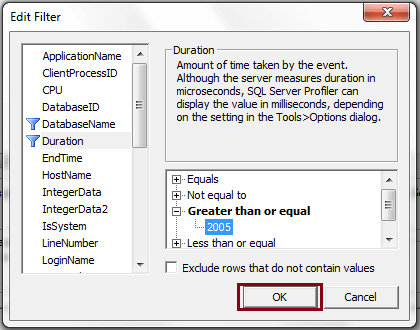
Next, I choose duration and in the right side pane under Greater than or equal, enter a value which is 1/1000th of a second. So 1000 is equal to 1 second, for our example I would be entering 2005, just to make sure the value is slightly higher than 2 seconds (pictured below).
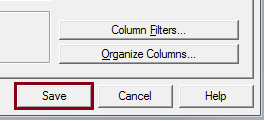
Click OK to return the previous dialog box. Click Save to complete the creation of a new trace template (pictured below).
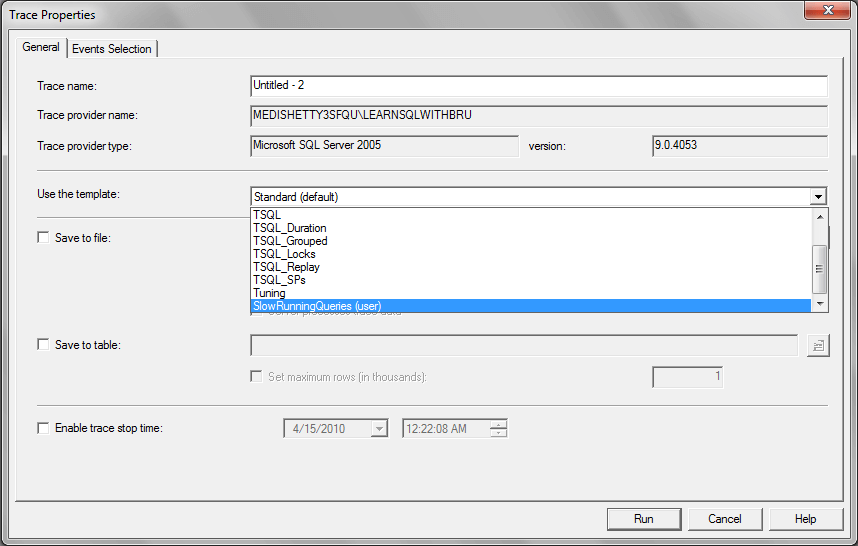
To confirm the creation of the new trace template, try creating a new trace, connect to appropriate SQL Server and when the trace properties dialog box appears, under "Use the template", choose the newly created template from the drop down list (pictured below).
Some points to be remembered
- Introduced in SQL Server 2005, Profiler can be used against SQL Server Analysis Services to trace the events that are running on that server.
- A trace template can be created based on a previous profiler trace.
Next Steps
- Read these SQL Server Tips related to Profiler Trace MSSQLTips


About the author
 Bru Medishetty focuses on Performance Monitoring and Tuning as well as planning and implementing Disaster Recovery solutions.
This author pledges the content of this article is based on professional experience and not AI generated.
View all my tips
