By: Tim Ford | Comments (4) | Related: > Performance Tuning
Problem
I'd seen you posted a tip on capturing SQL based PerfMon counters using sys.dm_os_performance_counters. What queries can I run against those stored results that would allow me to examine memory usage on my SQL instance?
Solution
Yes, my last tip showed you how you could persist performance counter values that are exposed through sys.dm_os_performance_counters into a table in a SQL Server database for querying. This is valuable because we can use these results to get an idea of what is occuring behind the scenes in our instances over time for the purposes of capacity planning, consolidation, and hardware upgrades or downgrades. It will also allow us insight into the "what happened" questions that arise after a performance issue occurs (like those 3:00am hiccups that the users complain about the next morning.)
There are two components to memory that we'll be looking at: Buffer Cache (also referred to as the Buffer Pool) and the Plan Cache. This tip exclusively covers the Buffer Cache/Pool. SQL Server uses the Buffer cache (aka Buffer pool) to store data read from physical disk for use in satisfying requests from the end users of the databases hosted on the instance. The trip to and from physical disk is much slower than using in-memory pages for reading and modifying data. Whenever possible, SQL will attempt to load and maintain data in the buffer pool if space permits rather than navigating to disk. Plan cache is the component of SQL memory that stores query plans for re-use. When a query is issued against SQL, the optimizer will attempt to re-use a cached plan if the traits of the query permit - but can only do so if that plan resides in cache. The topics of buffer pool/cache and plan cache are much to deep to cover as part of this tip. However, links are provided at the end of this article on much deeper essays covering these topics.
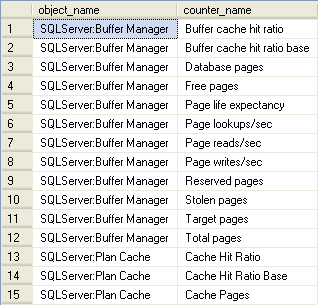
So what SQL memory metrics can we expect to be able to examine with the stored results from sys.dm_os_performance_counters? These are the counters that pertain to plan cache and buffer cache/pool that we're capturing if you were to follow my previous tip:
Buffer Pool/Cache Queries
The following queries cover three areas of interest when it comes to the Buffer Pool: Hit Ratio, Szie, and Activity in the Buffer Pool. I slice the results two ways for each area: detail (individual records captured for each counter on the scheduled collection cycle set in the SQL Agent Job we created in the previous tip), and summary - returning the minimum, average, and maximum value for a period of time for each counter. Let's look at the Buffer Pool first and then we'll move onto the Plan Cache in our next tip in this series.
Buffer Cache Hit Ratio
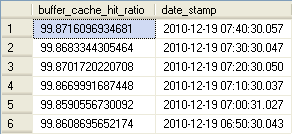
What exactly is the Buffer Hit Ratio? Well simply put, it is the percentage of requests that were satisfied from the in-memory Buffer Pool versus going to disk to pull data into memory first. Remember how I stated earlier that the trip to disk is extremely slow? It is typically the slowest action in SQL Server. This is why SQL Server (and SQL Server Database Administrators) L-O-V-E RAM. Give us as much as our servers and our budgets allow! Let's load the entire database into RAM! This means that we expect to (or should I say we WANT to) see as high a hit ratio as possible; greater than 90% is what we should have for a baseline. Two counters give us all the information we need to compute hit ratio. Our numerator - the measure of successful fulfillment from memory - is the Buffer Manager / Buffer cache hit ratio counter. The denominator is the Buffer Manager / Buffer cache hit ratio base counter which measures all request activity. The query used to calculate and present the invidual collection points is shown below. For each of the detail queries I am using a sampling of the previous hour of collections taken every 10 minutes.
-->Buffer Cache Summary<-----------------------------------------
DECLARE @start DATETIME, @end DATETIME
SELECT @start = DATEADD(hh,-1,GETDATE())
SELECT @end = GETDATE()

SELECT (Hits.[cntr_value] * 1.0 / Total.[cntr_value]) * 100.0 AS [buffer_cache_hit_ratio] , Hits.[date_stamp]
FROM
(
SELECT [cntr_value], [date_stamp]
FROM iDBA.[MetaBOT].[dm_os_performance_counters]
WHERE [counter_name] = 'Buffer cache hit ratio'
AND [date_stamp] BETWEEN @start AND @end
) Hits

INNER JOIN

(
SELECT [cntr_value], [date_stamp]
FROM iDBA.[MetaBOT].[dm_os_performance_counters]
WHERE [counter_name] = 'Buffer cache hit ratio base'
AND [date_stamp] BETWEEN @start AND @end
) Total
ON Hits.[date_stamp] = Total.[date_stamp]
ORDER BY Hits.[date_stamp] DESC;
-->Buffer Cache Summary<-----------------------------------------
DECLARE @start DATETIME, @end DATETIME
SELECT @start = DATEADD(hh,-24,GETDATE())
SELECT @end = GETDATE()

SELECT MIN((Hits.[cntr_value] * 1.0 / Total.[cntr_value]) * 100.0) AS [buffer_cache_hit_ratio_MIN]
, AVG((Hits.[cntr_value] * 1.0 / Total.[cntr_value]) * 100.0) AS [buffer_cache_hit_ratio_AVG]
, MAX((Hits.[cntr_value] * 1.0 / Total.[cntr_value]) * 100.0) AS [buffer_cache_hit_ratio_MAX]
FROM
(
SELECT [cntr_value], [date_stamp], [counter_name]
FROM iDBA.[MetaBOT].[dm_os_performance_counters]
WHERE [counter_name] = 'Buffer cache hit ratio'
AND [date_stamp] BETWEEN @start AND @end
) Hits

INNER JOIN

(
SELECT [cntr_value], [date_stamp]
FROM iDBA.[MetaBOT].[dm_os_performance_counters]
WHERE [counter_name] = 'Buffer cache hit ratio base'
AND [date_stamp] BETWEEN @start AND @end
) Total
ON Hits.[date_stamp] = Total.[date_stamp]
GROUP BY Hits.[counter_name];
Page Life Expectancy
The next Buffer Pool/Cache metric we will examine is Page Life Expectancy. This counter corresponds to the amount of seconds one can expect a page to last in the Buffer before being flushed in order to make room for new pages being loaded into the Buffer Pool. It helps to tell us how often the Buffer Pool is finding itself in need of writing lesser-used and aged pages to disk from memory in order to make room for pages that are required to satisfy a user request to be loaded into memory.
It therefore is a measure of how the size of the Buffer Pool corresponds and plays friendly with the discreteness of the data being touched by the end users. A low Page Life Expectancy could point to the need to boost the amount of RAM available to Microsoft SQL Server. According to many accounts - but always open to debate amongst the SQL Community - is the ideal value to expect for this counter. A value of 300 (or five minutes) seems to be the widely-quoted value to shoot for as a minimum. What happens inside the Buffer Pool is that as a page sits unreferenced by a user request it is slowly aged out of relevance and, without being required to fulfill a request it will be eventually flushed if space is required in the Buffer Pool to hold pages that are read from disk to satisfy a newer query. The query to review Page Life Expectancy is simpler than what we saw for Hit Ratio because only a single counter is required. The queries and associated sample results for both a detail run of 1 hours of data as well as an aggregate of 24 hours of data are presented below.
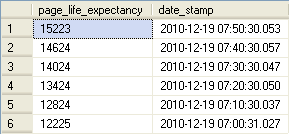
-->Page Life Expectancy Detail<-----------------------------------------
DECLARE @start DATETIME, @end DATETIME
SELECT @start = DATEADD(hh,-1,GETDATE())
SELECT @end = GETDATE()

SELECT [cntr_value] AS [page_life_expectancy], [date_stamp]
FROM iDBA.[MetaBOT].[dm_os_performance_counters]
WHERE RTRIM([counter_name]) = 'Page life expectancy'
AND [date_stamp] BETWEEN @start AND @end
ORDER BY [date_stamp] DESC -->Page Life Expectancy Summary<-----------------------------------------
DECLARE @start DATETIME, @end DATETIME
SELECT @start = DATEADD(hh,-24,GETDATE())
SELECT @end = GETDATE()

SELECT MIN([cntr_value]) AS [page_life_expectancy_MIN]
, AVG([cntr_value]) AS [page_life_expectancy_AVG]
, MAX([cntr_value]) AS [page_life_expectancy_MAX]
FROM iDBA.[MetaBOT].[dm_os_performance_counters]
WHERE RTRIM([counter_name]) = 'Page life expectancy'
AND [date_stamp] BETWEEN @start AND @end
GROUP BY [counter_name];
You may discern from the results of the two queries above that I may want to review what is occuring on the server when the Page Life Expectancy is registering below 300, particularly since the aggregate values have such a large range. What I would do in this case would be to dump the values to Excel and graph their discrete values to determine if there is a particular period of time where my Page Life Expectancy drops and if so, I would try to correllate that with activity on the instance. I will pursue precisely how to do that in a future tip in this series coming in the next month.
Buffer Pool/Cache Size
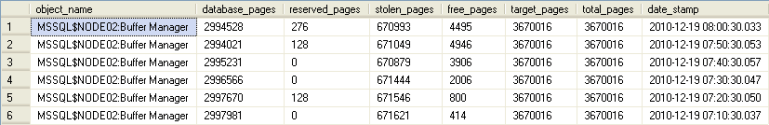
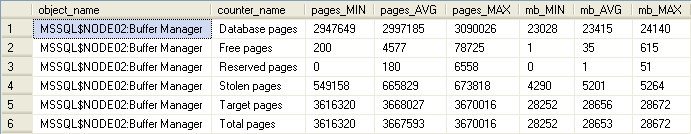
Our next set of queries as they pertain to the Buffer Pool/Cache examines its size. As mentioned at the beginning of this tip, both Buffer Pool/Cache and Plan Cache is measured in 8kb pages. This means that in order to look at this in terms of megabytes we'll need to do a simple conversion to kilobytes first (by multiplying the total number of pages by 8) and then converting to megabytes by dividing that value by 1024. You'll see this calculation below and later on when we look at the Plan Cache size as well. The Buffer Cache/Pool counter values for size in pages is divided into six areas of concern: Database (those pages storing database-related information) Pages, Free (those currently on all free lists) Pages, Reserved (for Buffer Pool use) Pages, Stolen (used for non-Buffer-related purposes - including Plan Cache, instance-level cache objects such as the lock table, connection context information, and cursor positioning information among other things) Pages, Target (the ideal number of pages SQL expects in the Buffer Pool) Pages, and _Total Pages (the sum of Database, Free, and Stolen pages in the Buffer Pool.) Besides using the cummulative values as a determination of Buffer size, it should be noted that the _Total Pages counter should typically match the Target Pages counter value.
-->For Memory Allocation - Buffer Size<-----------------------------------------
DECLARE @start DATETIME, @end DATETIME
SELECT @start = DATEADD(hh,-1,GETDATE())
SELECT @end = GETDATE()

SELECT
Total.[object_name],
DB.[pages] AS [database_pages],
Reserved.[pages] AS [reserved_pages],
Stolen.[pages] AS [stolen_pages],
Free.[pages] AS [free_pages],
Tgt.[pages] AS [target_pages],
Total.[pages] AS [total_pages],
Total.[date_stamp]
FROM
(
SELECT [cntr_value] AS [pages],
[cntr_value]*8/1024 AS [pages_in_mb],
[date_stamp]
FROM idba.[MetaBOT].[dm_os_performance_counters] dopc
WHERE [object_name] LIKE '%:Buffer Manager%'
AND RTRIM([counter_name]) = 'Database pages'
AND [date_stamp] BETWEEN @start AND @end
) DB

INNER JOIN

(
SELECT [cntr_value] AS [pages],
[cntr_value]*8/1024 AS [pages_in_mb],
[date_stamp]
FROM idba.[MetaBOT].[dm_os_performance_counters] dopc
WHERE [object_name] LIKE '%:Buffer Manager%'
AND RTRIM([counter_name]) = 'Free pages'
AND [date_stamp] BETWEEN @start AND @end
) Free ON DB.[date_stamp] = Free.[date_stamp]

INNER JOIN

(
SELECT [cntr_value] AS [pages],
[cntr_value]*8/1024 AS [pages_in_mb],
[date_stamp]
FROM idba.[MetaBOT].[dm_os_performance_counters] dopc
WHERE [object_name] LIKE '%:Buffer Manager%'
AND RTRIM([counter_name]) = 'Reserved pages'
AND [date_stamp] BETWEEN @start AND @end
) Reserved ON DB.[date_stamp] = Reserved.[date_stamp]

INNER JOIN

(
SELECT [cntr_value] AS [pages],
[cntr_value]*8/1024 AS [pages_in_mb],
[date_stamp]
FROM idba.[MetaBOT].[dm_os_performance_counters] dopc
WHERE [object_name] LIKE '%:Buffer Manager%'
AND RTRIM([counter_name]) = 'Stolen pages'
AND [date_stamp] BETWEEN @start AND @end
) Stolen ON DB.[date_stamp] = Stolen.[date_stamp]

INNER JOIN

(
SELECT [cntr_value] AS [pages],
[cntr_value]*8/1024 AS [pages_in_mb],
[date_stamp]
FROM idba.[MetaBOT].[dm_os_performance_counters] dopc
WHERE [object_name] LIKE '%:Buffer Manager%'
AND RTRIM([counter_name]) = 'Target pages'
AND [date_stamp] BETWEEN @start AND @end
) Tgt ON DB.[date_stamp] = Tgt.[date_stamp]

INNER JOIN

(
SELECT [object_name], [cntr_value] AS [pages],
[cntr_value]*8/1024 AS [pages_in_mb],
[date_stamp]
FROM idba.[MetaBOT].[dm_os_performance_counters] dopc
WHERE [object_name] LIKE '%:Buffer Manager%'
AND RTRIM([counter_name]) = 'Total pages'
AND [date_stamp] BETWEEN @start AND @end
) Total ON DB.[date_stamp] = Total.[date_stamp]
ORDER BY [date_stamp] DESC
-->For Memory Allocation - Buffer Size Summary<-----------------------------------------
DECLARE @start DATETIME, @end DATETIME
SELECT @start = DATEADD(hh,-24,GETDATE())
SELECT @end = GETDATE()

SELECT [object_name],
[counter_name],
MIN([cntr_value]) AS [pages_MIN],
AVG([cntr_value]) AS [pages_AVG],
MAX([cntr_value]) AS [pages_MAX],
MIN([cntr_value])*8/1024 AS [mb_MIN],
AVG([cntr_value])*8/1024 AS [mb_AVG],
MAX([cntr_value])*8/1024 AS [mb_MAX]
FROM idba.[MetaBOT].[dm_os_performance_counters] dopc
WHERE [object_name] LIKE '%:Buffer Manager%'
AND RTRIM([counter_name]) LIKE '% pages'
AND [date_stamp] BETWEEN @start AND @end
GROUP BY [object_name], [counter_name]
ORDER BY [object_name], [counter_name];
Buffer Pool Activity
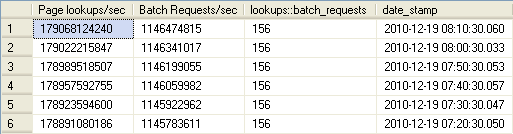
The final set of queries as they pertain to the Buffer Pool/Cache concerns activity within the Buffer Pool. Here we are able to compare page lookups within the Buffer Pool versus physical reads and physical writes to and from disk. Page Lookups relate to how frequently SQL is accessing in-memory pages. A high figure is neither good nor bad by itself. However, if you see a ratio of the value of the Page lookups/sec counter divided by the SQL Statistics / Batch Requests/sec counter value greater than 100 it may be an indication of inefficient query plans. Remember that disk activity is costly and we want to see as much activity coming from memory as possible. Before we compare lookups to physical reads and writes lets look at that ratio of lookups to batch requests:
DECLARE @start DATETIME, @end DATETIME
SELECT @start = DATEADD(hh,-1,GETDATE())
SELECT @end = GETDATE()

SELECT Lookups.[cntr_value] AS [Page lookups/sec],
[Requests].[cntr_value] AS [Batch Requests/sec],
Lookups.[cntr_value]/[Requests].[cntr_value] AS [lookups::batch_requests],
[Lookups].[date_stamp]
FROM
(
SELECT [cntr_value], [date_stamp]
FROM iDBA.[MetaBOT].[dm_os_performance_counters]
WHERE RTRIM([object_name]) LIKE '%:Buffer Manager'
AND RTRIM([counter_name]) = 'Page lookups/sec'
AND [date_stamp] BETWEEN @start AND @end
) Lookups
INNER JOIN
(
SELECT [cntr_value], [date_stamp]
FROM iDBA.[MetaBOT].[dm_os_performance_counters]
WHERE RTRIM([object_name]) LIKE '%:SQL Statistics'
AND RTRIM([counter_name]) = 'Batch Requests/sec'
AND [date_stamp] BETWEEN @start AND @end
) Requests ON [Lookups].[date_stamp] = [Requests].[date_stamp]
ORDER BY [Lookups].[date_stamp] DESC;
DECLARE @start DATETIME, @end DATETIME
SELECT @start = DATEADD(hh,-1,GETDATE())
SELECT @end = GETDATE()

SELECT MIN(Lookups.[cntr_value]/[Requests].[cntr_value]) AS [lookups::batch_requests_MIN],
AVG(Lookups.[cntr_value]/[Requests].[cntr_value]) AS [lookups::batch_requests_AVG],
MAX(Lookups.[cntr_value]/[Requests].[cntr_value]) AS [lookups::batch_requests_MAX]
FROM
(
SELECT [cntr_value], [date_stamp]
FROM iDBA.[MetaBOT].[dm_os_performance_counters]
WHERE RTRIM([object_name]) LIKE '%:Buffer Manager'
AND RTRIM([counter_name]) = 'Page lookups/sec'
AND [date_stamp] BETWEEN @start AND @end
) Lookups
INNER JOIN
(
SELECT [cntr_value], [date_stamp]
FROM iDBA.[MetaBOT].[dm_os_performance_counters]
WHERE RTRIM([object_name]) LIKE '%:SQL Statistics'
AND RTRIM([counter_name]) = 'Batch Requests/sec'
AND [date_stamp] BETWEEN @start AND @end
) Requests ON [Lookups].[date_stamp] = [Requests].[date_stamp];
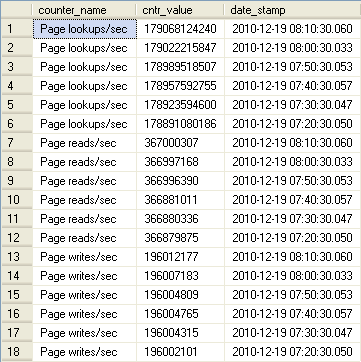
The good news is that apparently my SQL instance is consistent, however I may want to drill into poorly-performing queries to see if I can do some tuning! Now let's move on to analyzing logical reads versus physical reads and writes:
-->Buffer Cache Activity Detail<-----------------------------------------
DECLARE @start DATETIME, @end DATETIME
SELECT @start = DATEADD(hh,-1,GETDATE())
SELECT @end = GETDATE()

SELECT [counter_name], [cntr_value], [date_stamp]
FROM iDBA.[MetaBOT].[dm_os_performance_counters]
WHERE [object_name] LIKE '%:Buffer Manager%'
AND RTRIM([counter_name]) LIKE '%/sec'
AND [date_stamp] BETWEEN @start AND @end
ORDER BY [counter_name], [date_stamp] DESC;
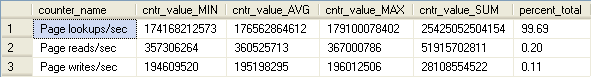
-->Buffer Cache Activity Summary<-----------------------------------------
DECLARE @start DATETIME, @end DATETIME
SELECT @start = DATEADD(hh,-24,GETDATE())
SELECT @end = GETDATE()

DECLARE @total_activity_count bigint

SELECT @total_activity_count =
SUM(cntr_value)
FROM iDBA.[MetaBOT].[dm_os_performance_counters]
WHERE [object_name] LIKE '%:Buffer Manager%'
AND RTRIM([counter_name]) LIKE '%/sec'
AND [date_stamp] BETWEEN @start AND @end
GROUP BY [object_name]

SELECT [counter_name],
MIN([cntr_value]) AS [cntr_value_MIN],
AVG([cntr_value]) AS [cntr_value_AVG],
MAX([cntr_value]) AS [cntr_value_MAX],
SUM([cntr_value]) AS [cntr_value_SUM],
CAST(((SUM([cntr_value]) * 1.0) / (@total_activity_count * 1.0) * 100) AS DECIMAL(5,2)) AS [percent_total]
FROM iDBA.[MetaBOT].[dm_os_performance_counters]
WHERE [object_name] LIKE '%:Buffer Manager%'
AND RTRIM([counter_name]) LIKE '%/sec'
AND [date_stamp] BETWEEN @start AND @end
GROUP BY [counter_name]
ORDER BY [counter_name]
In my next tip in this continuing series on persisted performance counters we will look at the Plan Cache and queries that will give us insight into its health and effect on performance.
Next Steps
- Other tips in this series are forthcoming. Tips still to come in this series include coverage of Plan Cache, CPU, and physical file-related queries and how this information can be utilized in consolidation planning.
- Additional tips on Retaining Historical Index Usage Stats from the Dynamic Management Views are available here:


About the author
 Tim Ford is a Senior Database Administrator with MindBody.
This author pledges the content of this article is based on professional experience and not AI generated.
View all my tips
