By: Bru Medishetty | Comments (4) | Related: > Profiler and Trace
Problem
In a previous tip we looked at the steps to Create a Trace Template in Profiler. In this tip we will look at a few more tips such as creating a trace template from an existing trace file and saving a trace file to a SQL Server table.
Solution
Creating a trace template from an existing trace file.
Why and how is this useful?
This is useful when you have a trace file stored in the past, especially where the events that are chosen are not available in a default trace or existing trace templates. Assume that as part of routine system diagnostics, you fired a profiler trace and chose certain events and moreover you applied some column filtering to track only those records you are interested in. You might require such a custom trace on a regular frequency. If you have not already created a trace template, then it can be created based on the old trace file you saved last time.
Steps to do this.
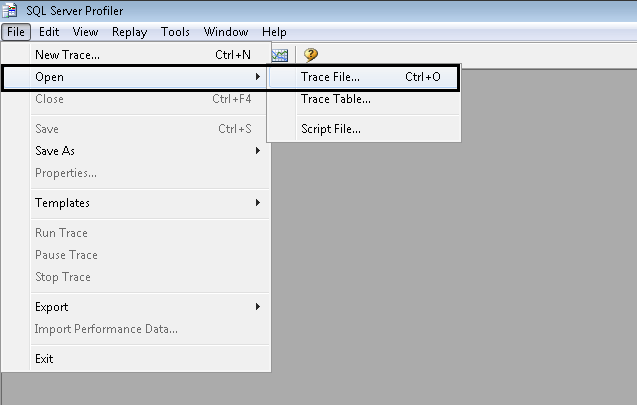
First we need to know the location of the old trace file. Once we are aware of this, we need to open the SQL Server Profiler. Upon opening Profiler, in the menu bar go to Open -> Trace File, as shown in the picture below.
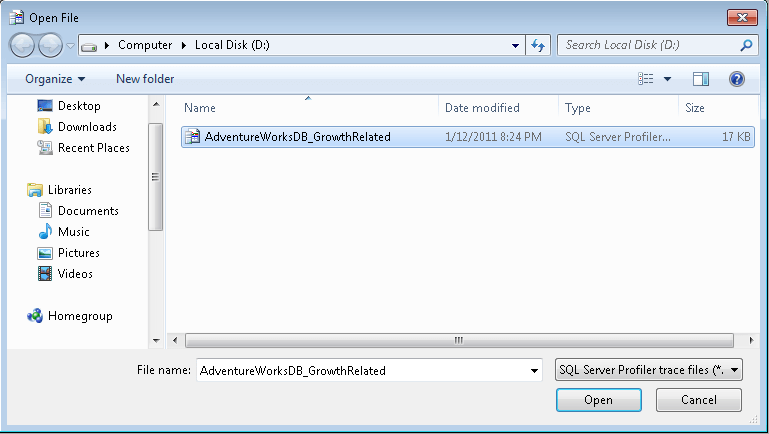
The Open File dialog box appears and we need to navigate to the location where the trace file is saved. Choose the trace file and click the Open button on the dialog box.
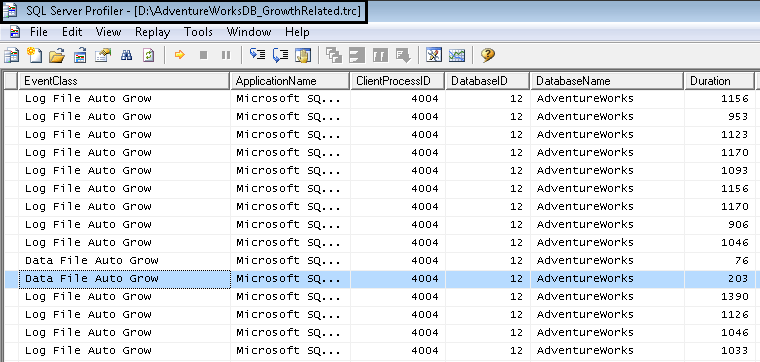
Profiler loads the contents of the trace file as shown in the image below. The trace file in this example is based on the Database events and I selected Data and Log file growth events and filtered to trace only the AdventureWorks database.
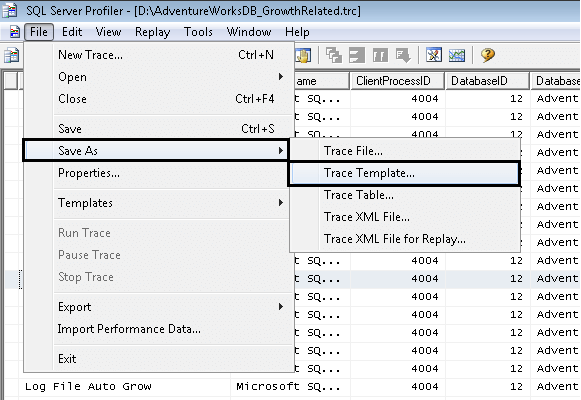
From the menu bar select Save As-> Trace Template option (see image below).
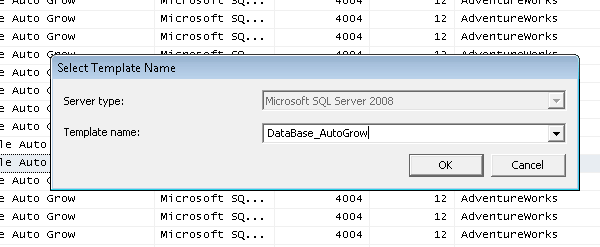
Type the new Template name. Choose a template name as appropriate as possible, to reflect the events selected in that trace. This way, the next time you need to use this Profiler trace you just look a the name instead of having to open it and look at the events that it captures.
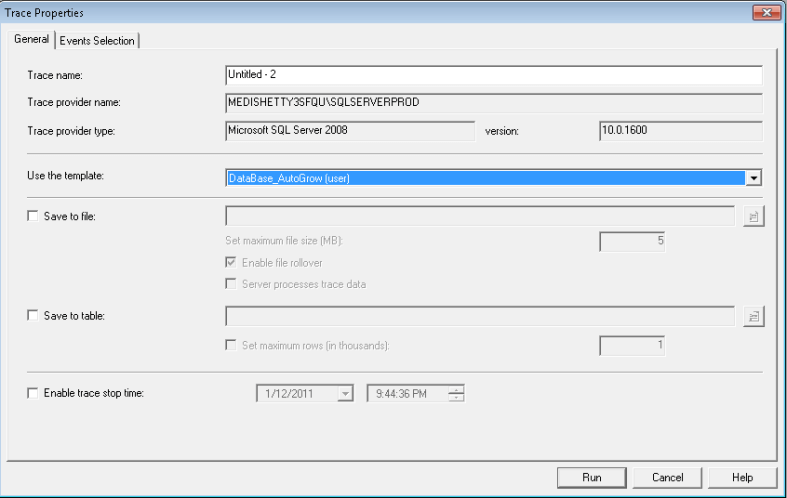
Once the trace template is saved you can use this trace template for any new trace you run. To do this, in the General tab, choose the trace template from the list of available templates.
Saving a profiler trace inside a database table.
Why and how is this useful?
Saving a profiler trace in a database table has multiple benefits. One way is that you can query the table for more granular level details. By adding multiple WHERE clauses to your query you can find only those records you are interested in. One of my personal favorites is retrieving data for a certain time period. This way I can look at those details between 4:00 AM to 5:00 AM. Moreover I can add other conditions to dig deeper and weed out non-important data while trying to solve a particular issue.
One other important benefit is we can delete data from the table that is not relevant making it easier while viewing the trace from Profiler.
Steps to do this.
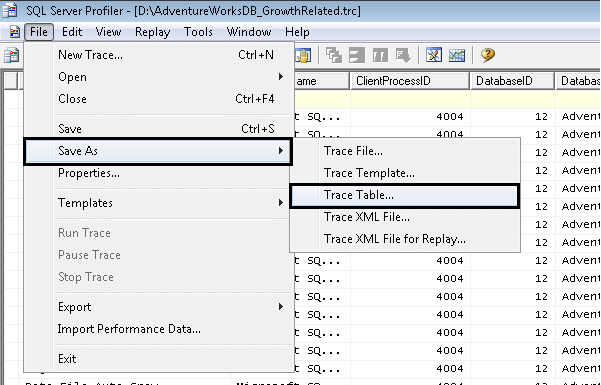
Open an existing trace file in SQL Server Profiler (described earlier in this tip). In the menu bar go to Save As -> Trace Table, as shown in the picture below.
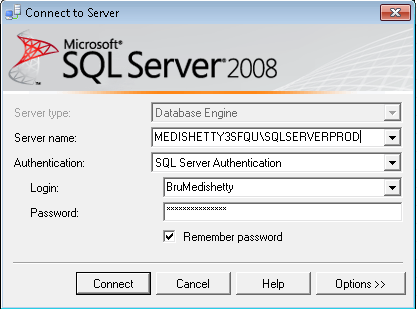
We need to provide the authentication details to connect the Server in which we want to store the trace table. From the picture below, you can see that I am connecting using SQL Server Authentication.
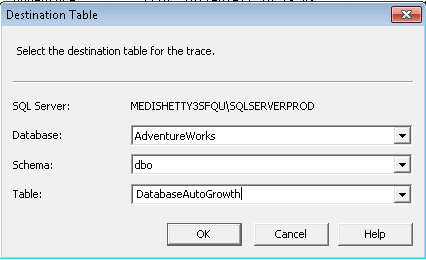
Upon successful connection to the Server, we are required to choose the database from the drop down list of the databases, by default the master database is displayed. I selected AdventureWork, but it would be a good idea to setup another database to store this data to keep it segmented from your other data. After that, we have to type in the name of the table if we are creating a new table, alternately you can choose an existing table which you are sure is no longer required. This is because the existing table will be overwritten, causing you to lose the entire table, the structure of the table and all data in it.
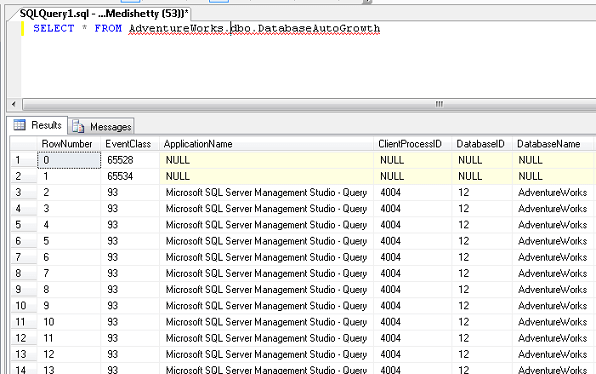
Once the trace is saved in a table, we can query it from SQL Server Management Studio (picture below).
Next Steps
- Read other tips related to Profiler Trace
- It would be a good idea to create a separate database to store these trace tables. This way the data is segmented from your user data. Also, if you don't care if you loose the data you don't need to backup the database. You can create a standard set of queries or stored procedures to use against these tables. If you have a bunch of these tables you could use a synonym to point to the table you want to query without having to recode the queries or stored procedures.


About the author
 Bru Medishetty focuses on Performance Monitoring and Tuning as well as planning and implementing Disaster Recovery solutions.
This author pledges the content of this article is based on professional experience and not AI generated.
View all my tips
