By: Arshad Ali | Comments (4) | Related: 1 | 2 | > Debugging
Problem
In one of my previous tips (SQL Server 2008 T-SQL Debugger is back in SSMS) I talked how you can debug your T-SQL routine/module. Although it was very handy for SQL Server Developers to debug code, the tools still lacked some of the basic features that are already available for .NET Developers. For example, you are not allowed to add conditions to the breakpoint, filter the breakpoint, getting more information about runtime values or expressions. SQL Server 2012 overcomes these shortcomings with improved debugging in SQL Server Management Studio. So how does SQL Server 2012 save developers from hours of frustrating debugging and helps to improve their productivity? Check out this tip for these answers and more.
Solution
In my previous tip I talked about basic T-SQL debugging (debugging is a mechanism which allows you to find errors in your code by investigating the run time behavior of the code) in SSMS. In this tip, I am going to take that discussion further and talk about debugging enhancements in SQL Server 2012. Now SQL Server Management Studio (SSMS) is powered by Visual Studio so T-SQL Developers, will have almost all of the debugging features available for .NET Developers. SSMS debugging capabilities allow you to debug script blocks, stored procedures, functions and triggers.
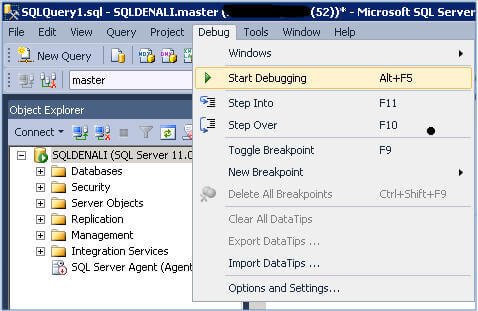
To start debugging your T-SQL code, you can either:
- Click on the Debug button on the Query toolbar
- Click on the Start Debugging menu item on the Debug menu as shown below
- Press ALT+F5
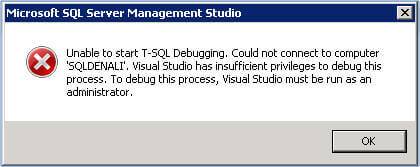
If you are not running SSMS as an administrator (or in elevated mode) and try to start debugging, you will see an exception as shown below. Please note, as I said before SSMS is now powered by Visual Studio.
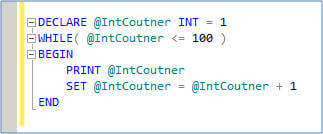
Now for a demonstration, let me setup the environment. What I am doing in the code below is declaring a variable and setting its value to 1. Next I have a loop which checks the value of this variable and iterates as long as it is less than equal to 100. Inside the loop I am incrementing the value of variable by 1 on each iteration. Reference the code below:
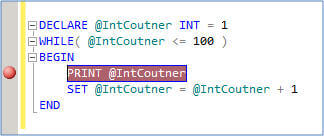
To set/toggle a breakpoint on a line, go to that line and press F9 or go to Debug menu and click on Toggle Breakpoint menu item. Once a breakpoint is placed you will notice a red circle on the left side of the line as shown below:
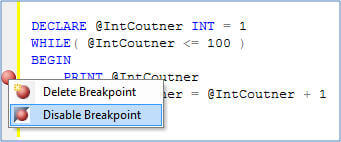
If you are using SQL Serve 2008 or SQL Server 2008 R2 SSMS and right click on the breakpoint symbol (red circle) you will notice you will have just two options, first to delete the breakpoint or second one to disable the breakpoint as shown below:
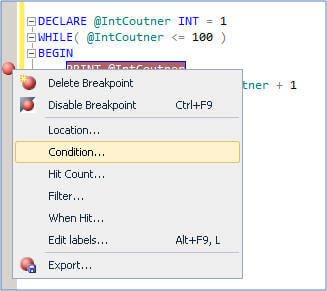
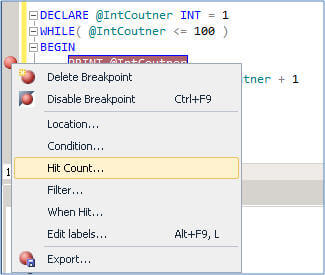
If you are using SQL Serve 2012 SSMS and right click on the breakpoint symbol (red circle) you will notice additional options as shown below. Clicking on the Condition menu item lets you define the condition on which execution will pause on that breakpoint or line. This comes in handy when you have to loop through hundreds or thousands of iterations and you want to pause the execution on the occurrence on certain condition. For example, an expression evaluates to true or the value of variable changed.
While defining the breakpoint condition, you can specify when the breakpoint will be hit; it could be either when the expression returns true after evaluation or when the value of a variable is changed. After placing a condition on the breakpoint, a white plus sign appears inside the breakpoint red circle to indicate it has condition attached.
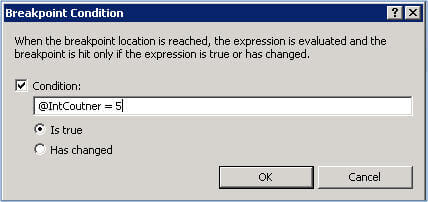
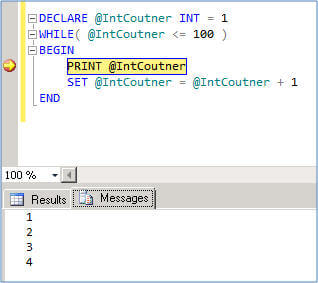
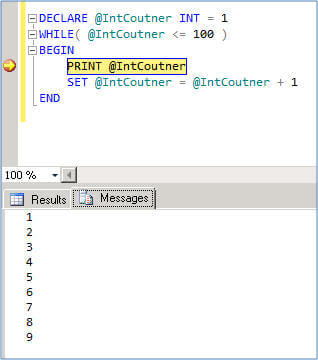
For example, I have specified the condition that when variable value reaches to 5 breakpoint (execution should pause as shown above) should be hit and this is what has happened as you can see below:
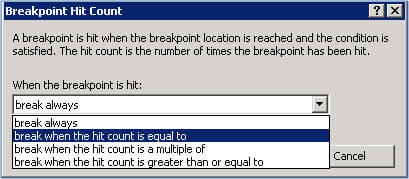
A breakpoint hit count allows you to specify the condition to pause the execution if the breakpoint has been hit for specified number of times. Again this comes in handy when you have a loop through hundreds or thousands of iterations and you want to pause the execution on the certain numbers of iterations.
You can specify the hit count as follows:
- Break always
- Break when the hit count is equal to (some specified value)
- Break when the hit count is a multiple of (some specified value)
- Break when the hit count is greater than or equal to (some specified value)
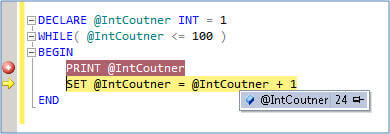
As I have specified the execution to pause on reaching the hit count of 10, you can see it has paused the execution when the value of the variable is 10.
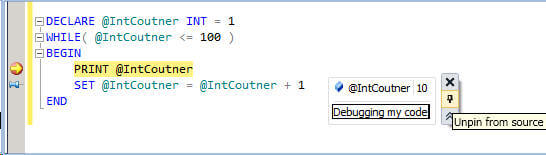
Along with Watch window, local window etc. SQL Server 2012 debugger has quick info pop up (also called Data tips) when you move your cursor over a T-SQL identifier as shown below. You also have an option to pin this quick info during the during execution of your session and it will appear again next time you start debugging. You also have the option to add comments while debugging.
Notes
- As I said in my last tip, SQL Server 2008 and later version supported debugging SQL Server 2008 and later only. With SQL Server 2012, you can debug your T-SQL scripts on SQL Server 2005 SP2 and later.
- SQL Server 2012 debugging allows changing the variable value at runtime in the local window, T-SQL expression evaluation in Watch & Immediate Window, etc.
- If you want to debug from a computer other than the instance of SQL Server then you need to configure a firewall rule, click here for more details.
- The sample code, example and UI is based on SQL Server 2012 CTP 1, it might change in the RTM release or later versions.
Next Steps
- As you prepare for SQL Server 2012, be sure to remember this feature as a one of many benefits to help your productivity.
- Review these related resources:


About the author
 Arshad Ali is a SQL and BI Developer focusing on Data Warehousing projects for Microsoft.
This author pledges the content of this article is based on professional experience and not AI generated.
View all my tips
