By: Vamsi Bogullu | Comments (3) | Related: > Analysis Services Development
Problem
I have a need use a few different rating methods to classify my customers as Great, Very Good, Good, etc. We are using SQL Server Analysis Services and I have heard you can create a cross tab report between two members on a same dimension of a SSAS cube? Do you have any suggestions on how to implement this functionality? Check out this tip to learn more.
Solution
Cross tab reports are useful to find data transition/associations between two members. Real world examples include: using cross tabs to find swap sets, credit rating transition among different scoring models, etc. For this tip, let's consider a scenario where we score/rate our customers using different rating methods and classify them as "Great", "Very Good", "Good", "Not Good" or "Bad". Now we want to compare the data between different scoring methods to find swap sets. We might find that some customers who were classified as "Great" with one scoring method might not be classified as "Great" with a different scoring method. In this circumstance, we want to apply different business strategies. So let's jump right in.
Below is the schema we will use for this example:
SSAS Cube Implementation
In order to create cross tab reports between members of the same dimension we need to design a many to many relationship in the SSAS cube. Below is the relational schema of the model. nq_Fact_CustomerRating_CT is a named query on "Select * from Fact_CustomerRating", this will be a factless fact table in the model.
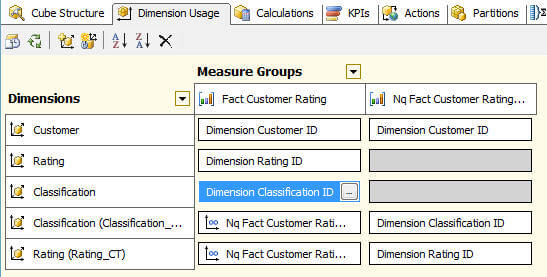
Below is the Dimension Usage of the model, it includes two new dimensions Classification_CT and Rating_CT which will be used for slicing and dicing on the factless fact table.
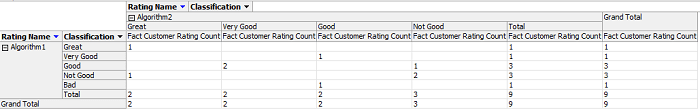
Let's look at the data using the cube browser, we have 9 customers and 2 rating methods which classify the customers into 5 categories.
Now by adding the Rating_CT and Classification_CT on the column axis we can generate a cross tab report as shown in the figure below. The data is filtered to show Algorithm1 on Rows and Algorrithm2 on Columns. This cross tab report is very straight forward to find swap sets; for example it shows that there is 1 customer who is rated as "Not Good" with Algorithm1 where as the same customer is rated as "Great" with Algorithm2. By identifying these swap sets and depending on how far apart they are business analysts can deploy different strategies to these customers.
Next Steps
- Use the included database backup and the SSAS project to try this approach to do cross tab reports.
- I would be interested in knowing if there are other approaches to solve this same issue.
- Check out all of the SQL Server Analysis Services tips.


About the author
 Vamsi Bogullu is a Database Architect administering database servers, developing applications and designing enterprise BI solutions.
This author pledges the content of this article is based on professional experience and not AI generated.
View all my tips
