How to find out how much CPU a SQL Server process is really using

By:   |   Comments (60)   |   Related: 1 | 2 | 3 | 4 | > Performance Tuning


Problem

Someone has reported a performance issue for your SQL Server application. When you look into the database server you see CPU utilization is very high and the SQL Server process is consuming most of the CPU. You launch SSMS and run sp_who2 and notice that there are a few SPIDs taking a long time to complete and these queries may be causing the high CPU pressure. At the server level you can only see the overall SQL Server process, but within SQL Server you can see each individual query that is running. Is there a way to tell how much CPU each SQL Server process is consuming? In this article I explain how this can be done.

Solution

Normally we monitor this type of issue using sp_who2, Activity Monitor or DMVs. If there are a lot of processes running on your instance and the CPU is very high, then it's hard to find the exact process eating up your CPU using just the SQL Server tools. One way to correlate the data between what is running within SQL Server and at the Windows level is to use SPID and KPID values to get the exact process.

Before discussing how to do this, we should discuss these terms:

  • SPID is the SQL Server Process ID number and is assigned by SQL Server to each new connection. It starts with one and is globally unique. SPID 1 through 50 are reserved for system uses and are not used for any user connections.
  • KPID is the kernel-process ID. Under SQL Server for Windows this is the thread ID number, also known as "ID Thread," and is assigned by Windows when the thread is created. The Thread ID number is a system-wide identifier that uniquely identifies the thread. KPID is visible by querying the KPID column of master..sysprocesses. It is only filled in for spid numbers four and higher. You can also get KPID/ID Thread from Windows Perfmon using the "Thread" object and the "ID Thread" counter.

I am sure you are familiar with the SPID value, but have you ever noticed KPID? Probably not unless you queried the sysprocesses view directly. Let's look at example of how this works.


Example

Step 1
If we look at Task Manager on the server we can see the CPU usage. So the first step is to verify that the SQL Server process (sqlservr), and not some other process, is responsible for the excessive CPU use. Remember, the "sqlservr" process is made up of many different threads, each one generally (but not always) representing a specific user connection. In the screenshot below we see the sqlservr process is taking approximately 70 percent of CPU.

verify the sql server process

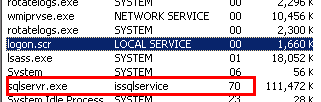
Now that we know SQL Server is the main culprit and responsible for the high CPU, the next step is to find out which SQL Server process is causing the high CPU.

Step 2
Now we need to find out what SQL Server thread is causing the high CPU. Once we have this ID Thread we can correlate that ID thread (KPID) to the SPID in SQL Server.

We will use Performance Monitor to get this info. Type perfmon in a Windows CMD prompt or launch from Control Panel.

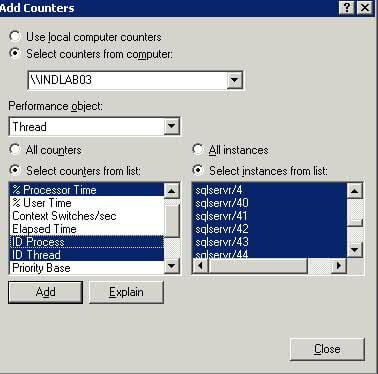
Click on Add counters and select the "Thread" object in the drop down.

Select these counters at the same time:

  • % Processor Time
  • ID Thread
  • Thread State
  • Thread Wait Reason

In the right pane, you will see multiple instances from multiple applications, which are running on that server. Since we are looking for "sqlservr" select all of the instances that begin with "sqlservr" from the list box as shown below and click Add. You can add other counters as needed and will see below that I added a few additional counters.

select all the instances that begin with "sqlservr"

Step 3
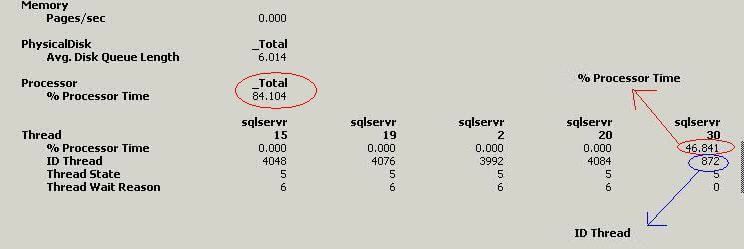
Press (Ctrl+R) or click on the view Report tab to change from graphical to report view as shown below. Here you should be able to find which ID Thread is eating up your CPU resources by using the scroll bar to see all instances.

Below we have identified which thread is causing the problem. Here you can see ID Thread 30 is taking 46.841% of the total CPU. You can also find the ID Thread which is 872. Now that we know the ID Thread, we can run a query in SSMS to find the actual query.

having identified the id thread, run a query in ssms

Step 4
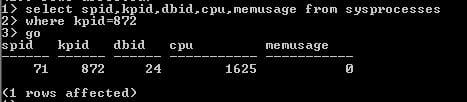
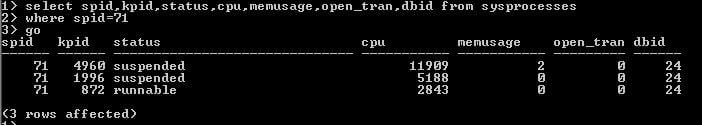
Our last step is to correlate the Thread ID (KPID) identified in the last step to the SPID. To do this, run the following query in Query analyzer:

SELECT spid, kpid, dbid, cpu, memusage FROM sysprocesses WHERE kpid=872

correlate the thread id(kpid) to spid

Step 5
From the query above we can see SPID 71 is causing the issue. To find how many threads and open transactions this is running we can run this query.
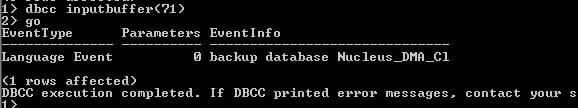
SELECT spid, kpid, status, cpu, memusage, open_tran, dbid FROM sysprocesses WHERE spid=71

sp id

Step 6
To get the exact query that is running, we can run DBCC INPUTBUFFER using the SPID. The below output shows us that a backup job is causing our CPU issues on our server.

run dbcc inputbuffer using spid

Next Steps
  • Use this procedure to find the main culprit in SQL Server which is eating up your CPU. You can use this correlation in many performance related tasks and can track many Perfmon counters to an individual thread and with that you can optimize your SQL Server.
  • If you have a lot of SQL Server processes, you can use the line graph in Perfmon to find the process that is using high CPU and hover over the line in the chart and it will show you the SQL Server thread. Then you can change to the Report view and scroll over to that SQL Server process to see the details for the counters you selected.


sql server categories

sql server webinars

subscribe to mssqltips

sql server tutorials

sql server white papers

next tip


About the author
MSSQLTips author Manvendra Singh Manvendra Singh has over 5 years of experience with SQL Server and has focused on Database Mirroring, Replication, Log Shipping, etc.

This author pledges the content of this article is based on professional experience and not AI generated.

View all my tips


Comments For This Article


Thursday, October 3, 2019 - 10:03:10 AM - Nazareth Berlanga Back To Top (82658)

Excellent. Thank you! 


Wednesday, March 13, 2019 - 6:53:10 PM - Tung Dang Back To Top (79287)

Awesome post!  It helped me out tremendously!


Wednesday, April 18, 2018 - 1:00:07 PM - Milan Back To Top (75728)

 My sql server 2014 sp2. And my database size is more than 2tb. My tempdb size is 30 gb. How much ram required to process smoothly of fetching, inserting in deleting crore of rows at a time 


Monday, March 19, 2018 - 2:32:55 AM - Marcus Deubel Back To Top (75459)

Hi there,

great posts! Is it possible to use process explorer to find out the thread instead of performance counters?


regards

Marcus


Saturday, September 23, 2017 - 5:56:48 PM - kevin Back To Top (66558)


 so i ran your method on our prod server, but i noticed 3 threads  with processor times that totaled more than 100%. is this normal? i thought they were all supposed to equal 100% combined. thanks


Tuesday, August 8, 2017 - 6:46:02 AM - Nishant Paliwal Back To Top (64296)

Hey I need on help.

As we can see there is CPU time in sysprocesses which tell us cumulative time taken by that process till now. And , now we also have a  sys.dm_exec_query_stats , in this view we have last_worker_time which tell that hwo much time taken by our query in the last run. So what is the difference between both CPU time ( sysprocesses) and last_worker_time (sys.dm_exec_query_stats) . 

One broad thing is one session can have multiple queries running on that. 

As I one case - 

My session is running from last 15 mins in this session i ran a query and  now for the last 15 minutes my CPU Time is .144 microseconds but my last_worker_time is 4.32 sec . So how is it poosible that cpu time is so much less than last_worker time.

Thanks in advance.


Saturday, December 3, 2016 - 10:56:53 AM - Raj Kamal Singh Back To Top (44896)

Excellent Article. Could you please give the same article related to High Physical memory usage by SQL Server instead of CPU..


Thursday, November 3, 2016 - 8:47:56 AM - Tapan Back To Top (43691)

Hello Experts,

    Please help me to shut out the problem.

  SQL version 2014 SP2 , Windows 2012

Problem- When ssrs service  touching 100% cpu application team not able to report server database. We restarting every time  the ssrs service as temporary solution and able to access then. During that time period sql is having no problem. No blocking,NO long runners, No open sessions.

Already those things we checked. Moreover we changed the report server configuration parameters that also not help us.

In both the server Replication is enabled. we separate the loads and still high cpu is triggering.

I request please provide me a solution .I just want to clarify that no reports aborted in the error log, No error found in ssrs log.


Thanks in advance.


Thursday, July 16, 2015 - 4:11:07 PM - Ray Back To Top (38228)

master..sysprocesses is deprecated and really should not be used.

I like your approach but you should consider refactoring it to use the DMVs which generally provide more detailed information.

sys.dm_os_threads has a column named os_thread_id which is probably the column corresponding to KPId.

The DMV provides much of the information you would get from Perfmon and can be joined with other DMVs to get a very detailed picture of exactly which query is causing issues.

Nice article 


Tuesday, June 9, 2015 - 8:47:51 AM - Venkatesh Chagi Back To Top (37867)

Excellent Tips, I really like the way Author explains the issues and resolution.. I really find this site very very useful

Thanks again for a great portal


Sunday, March 22, 2015 - 12:55:40 AM - RajKumar Back To Top (36623)

46% is not total cpu %.  It is the thread utilzation. If you include %processor time for thread id it will give the exact value.


there could be 5 or 6 process which would have greater than 90% you need to add and compare it to thread id %processor time.


Monday, March 2, 2015 - 4:04:24 AM - Bo Back To Top (36396)

Create blog. I am going to bookmark this.


Tuesday, February 3, 2015 - 10:24:18 AM - dan Back To Top (36145)

When select counters, It doesn't give me option as you have shown above " In the right pane, you will see multiple instances from multiple applications, which are running on that server. Since we are looking for "sqlservr" select all of the instances that begin with "sqlservr" from the list box as shown below and click Add. You can add other counters as needed and will see below that I added a few additional counters."

I get * for all instance!!!! Please help


Wednesday, December 24, 2014 - 1:35:49 PM - Pravin Back To Top (35758)

We have a SAN for storage and decent server. Still the query results comes back slow. I have a feeling that the SQL procedures don't work slow, but san being shared is actually makes it slow...also the physical server is being used by other apps. my question is how do I prove that db stored procedures etc are not slow...and that the slowness is due to 1. server being used by other apps 2. san being shared returns slow results.

ok, one more hitch is san and server being managed by different teams. So easy access may not be there.

Please guide!


Thursday, August 28, 2014 - 7:52:31 AM - Mohammad Aslam Back To Top (34307)

Hi Syed,

first you need to find which sql instance is causing this issue. You can get an idea from task manager itself by sorting it for sql server processes/cpu wise. Right clicking the process will bring you to sql server instance name.

Of course, you can also find the intance id using perfmon (ID process )

 or

serverproperty


('ProcessID'


 or

Service configuration manager as well.

You can then connect to that sql instance and fire the above queries, from any database.

The dbid column in the query will give you the id of the db where the spid is running.

Hope it helps.


Wednesday, August 27, 2014 - 1:53:27 PM - Syed Back To Top (34289)

What if someone has 4 instances running on the server. How would I find out, which DB to use? Where exactly you ran this query?


Tuesday, July 15, 2014 - 2:44:29 PM - Kumar Back To Top (32718)

Pls correct me if i'm wrong. By using SP_who2 we can find most cpu/disk IO consuming spid and using DBCC inputBuffer we can get specific query for that spid. Is it different from using perfmon.exe ? 


Tuesday, February 25, 2014 - 8:06:12 PM - Juan V Back To Top (29575)

Great writeup. Still works with server 2008 R2 and SQL 2008  R2 cant wait to put this to use tomorrow with a high CPU usage.  tested it localy using this query from SQL authority, and was able to trace it back sucesfully. Thanks again.  

DECLARE    @T DATETIME, @F BIGINT;

SET @T = GETDATE();

WHILE DATEADD(SECOND,300,@T)>GETDATE()

SET    @F=POWER(2,30);


SELECT spid, kpid, dbid, cpu, memusage FROM sysprocesses WHERE kpid=464

SELECT spid, kpid, status, cpu, memusage, open_tran, dbid FROM sysprocesses WHERE spid=57

DBCC INPUTBUFFER(57)


Tuesday, February 4, 2014 - 1:39:55 AM - ram Back To Top (29322)

Wowwwwwww what a great answer Manvendra Singh really every dba must know this..... hats of Singh


Friday, October 11, 2013 - 1:28:56 AM - Mainoddin Back To Top (27114)

Hi manavendra,


Thanks a lot for saring your valuable knowledge  with us . and i have one doubtis it work only power shell or migght be in query also.


Monday, September 23, 2013 - 4:52:14 PM - Craig Back To Top (26903)

I took your queries (thank you VERY much) and made a powershell script based on them.  My particular interest is when the SCOM database is being pounded. It is not a fancy script but it will get all the SQL threads and then process all threads using more than a specified value (variable in the script).  Once it has the threads, it goes through each thread and finds the SPID and then executes the DBCC Inputbuffer(#) and displays the results.  It is a LOT faster than I can do it.  Server 2008 does not give me an option to pick the instances for the threads for some reason so it is a big pain to use perfmon.


http://www.systemcentercentral.com/whats-taking-sql-cpu/


If anyone sees a way to improve that script... I'd love to see the improvements.


Friday, March 22, 2013 - 12:29:27 PM - Atchi Back To Top (22964)

It's very good one...!!


I have one doubt here. Can you please explain about Thread state  and Thread wait Reson

I have seen 6 and 0 values in perfomon

Can you please correct me If I am wrong.

Thread State '5' means--Is it running state (Active state)

There are 0,6 values for Thread wait reson..what does mean of values?


Thanks

Atchi


Thursday, March 7, 2013 - 6:08:26 AM - Subba Reddy Back To Top (22626)

Nice..


Tuesday, March 5, 2013 - 7:29:01 PM - MP Back To Top (22579)

Very Very good article ! Thanks Manvendra.

Have a question about step 3. When I tried to use this process. I have more than 200+ thread and find it hard to scroll through it to find the one which use most CPU. There is a good chance to miss the real one while moving bar on right side(some time it got updated while moving bar). Is there any other way we can find the thread directly which use max CPU ?


Tuesday, February 26, 2013 - 8:28:43 AM - Aslam Back To Top (22425)

Good One , Buddy.


Wednesday, January 30, 2013 - 10:50:54 PM - Subhani Sahik Back To Top (21814)

Awesome :)


Wednesday, January 23, 2013 - 12:09:22 AM - Harry Back To Top (21635)

Interview cracking article!!! I explained interviewer ditto yesterday and he said "WOW" - Excellent skill to track whats going on around...M joining new place couple weeks later :)

Thanks Buddy!


Thursday, January 17, 2013 - 7:06:30 AM - jagadish Back To Top (21509)

that was an awesome article.. and it helped me in all the way i need.. very good guys just keep go on and publish some good articles.


thanks

jagadish


Tuesday, December 11, 2012 - 1:53:28 AM - Devi Prasad Back To Top (20860)

Such a helpfull article. I could not stop myself put a line for you.


Thanks,

Devi Prasad


Tuesday, December 4, 2012 - 7:02:48 PM - Bala Back To Top (20745)

Hi Man,

You are amazing! Awsome doc. Great Job!!!

Thanks.


Thursday, November 29, 2012 - 11:08:31 AM - Fekadu Back To Top (20633)

Good job with nice and clear example. Can you do that for memory too?

Thanks


Friday, October 12, 2012 - 12:48:11 PM - Pawan Singh Back To Top (19897)

It is really good and it helped me a lot while trobleshooting the same problem.

Thanks a lot !!!! :)


Wednesday, September 19, 2012 - 2:01:31 AM - Srinivasa Reddy Back To Top (19560)

Excellent writeup in step-by-step manner. Really very very  good one and amazing


Monday, September 17, 2012 - 9:49:33 AM - Dinesh Back To Top (19535)

Hi, I wanted to ask you one question here, when we select the counters for all the instances like db01, db02...running on server, with the specified kpid, how to find out from which sql server instance is this kpid?


Monday, September 17, 2012 - 9:39:12 AM - Kumar Back To Top (19533)

Awesome buddy .


Thanks for sharing this info .


Monday, July 23, 2012 - 12:25:28 PM - k Back To Top (18753)

good stuff, thanks


Wednesday, July 18, 2012 - 2:11:56 PM - Tariq Back To Top (18614)

Nice and easy. Thanks!


Thursday, June 21, 2012 - 11:49:30 AM - Mohanraj Back To Top (18156)

Thanks for sharing the information and this is what i wanted to find out the CPU Usage.


In most of production servers, we would see many sql sessions so its very difficult to the Kernal Process ID which took greated CPU utilization.

so do you have any idea about query the perfmon.

Sysperfinfo will have sql server related counters but not kernal level.

Please share if have such information.


Tuesday, June 12, 2012 - 11:16:44 PM - Sri Back To Top (17955)


Thank you very much..


Wednesday, April 25, 2012 - 1:38:30 PM - bud Back To Top (17109)

Thanks so much for this great article and the great suggestion.  I was wondering if I collected the above listed threads (only for sqlsrvr 2008) for a period for say a day or a couple of days, whether there is some DMV or some internal SQL feature that I can corelate.  We are after those sql jobs that continuosly CPU spike.  Thanks again.


Monday, February 20, 2012 - 4:33:57 PM - Christoph Back To Top (16103)

Ah, I have to click search-Button to see something.

Thanks.


Thursday, February 16, 2012 - 10:18:32 AM - Manvendra Back To Top (16040)
Yes its lil different in Win2k8R2. There is a dropdown along with a search button.Just select "All Instances" in that drop down and click on search button.it will display all instances of your selected object, now you can choose only sql server processes by pressing cntrl button.

Thursday, February 16, 2012 - 9:20:28 AM - Christoph Back To Top (16039)
Hi On our Win2008R2-Server, the View of "Add Counter" doesn't display the instances, only "All" can selected. When I select all, then the differenz Counters of all instances is insertet. What the reason, that I cant's select my SQL-Server-Instance? best regards Christoph

Tuesday, December 13, 2011 - 4:08:53 AM - Manvendra Back To Top (15344)

Thank you guys for such a great feedbacks.


Thursday, November 17, 2011 - 9:57:45 AM - Idris Chambas Back To Top (15147)

Superb. A brilliant way of finding the smoking gun. Many Thanks.


Tuesday, September 20, 2011 - 5:42:59 AM - M Azim Back To Top (14695)

Excellent and precisely explained


Friday, August 26, 2011 - 8:35:49 AM - Nitin Kumar Back To Top (14528)

Excellent writeup in step-by-step manner. Really good one.


Saturday, August 20, 2011 - 5:05:56 PM - bool Back To Top (14454)

Very well explained one... I was searching for this for very long


Saturday, August 20, 2011 - 1:28:48 PM - Bunty Back To Top (14453)

Very well explained and this article is very useful for core DBA's. Great job !!!!!


Saturday, August 20, 2011 - 9:45:09 AM - SurendraP Back To Top (14452)

It is really good post and it helped me a lot while trobleshooting the same problem.

Thanks a lot !!!! :) 


Tuesday, August 16, 2011 - 9:08:00 AM - rajendra Back To Top (14406)

Nice one!!!!!!!!!


Sunday, August 14, 2011 - 8:38:30 PM - Kyle Back To Top (14398)

This is amazing.


Thursday, August 11, 2011 - 7:30:45 AM - Jey Nav Back To Top (14372)


Really Good one.


Thanks,


Thursday, August 11, 2011 - 5:48:56 AM - Hans Back To Top (14368)

Once in a while, a diamond article pops-up; this is one of those articles! Thank you for the excellent publication.


Wednesday, August 10, 2011 - 11:07:59 AM - Sasi Back To Top (14360)


Yep...that helps us a lot


Wednesday, August 10, 2011 - 2:15:57 AM - Ajay Gupta Back To Top (14356)

Thanks a lot


Tuesday, August 9, 2011 - 7:07:53 PM - Manish Back To Top (14354)

Thanks for sharing Knowledge.


Tuesday, August 9, 2011 - 4:15:36 PM - Excellent article. Thank you so much. Back To Top (14353)


Tuesday, August 9, 2011 - 1:39:22 PM - Satinder Thakur Back To Top (14351)

Goood Job!  Fantastic ...!!!


Tuesday, August 9, 2011 - 3:26:32 AM - Mohammed Moinudheen Back To Top (14347)

Good one. Thanks.


get free sql tips
agree to terms