By: Brady Upton | Comments (19) | Related: 1 | 2 | > Reporting Services Development
Problem
SQL Server Reporting Services has some cool features such as displaying maps and data points on the maps. In this tip I show how to take a list of addresses and display them as pinpoints on a map in an SSRS report.
Solution
With SSRS 2008R2 you have the capability of adding maps to your reports using spatial data. In this tip I'll show you how to accomplish this.
If you have a table with addresses, zip codes, etc. we'll need to find the latitude and longitude of each address. You can accomplish this by using a geocoding website. There are many out there but I use http://www.gpsvisualizer.com/geocoder/ because it's fast and easy to copy and paste multiple addresses into their input box, click "start geocoding" and within seconds it will output latitude and longitude information.
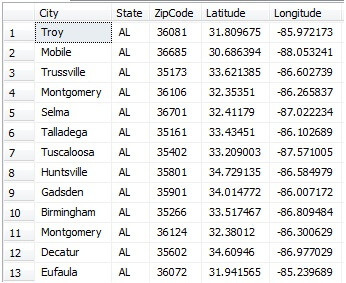
Once you get the latitude and longitude information you can import it into your database. See below for an example of my table of Alabama cities and zip codes with their appropriate coordinates.
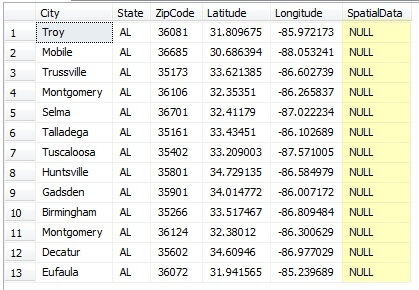
Once you have your coordinates we will need to create a new column with a geography data type that we will add our spatial data into. The following code will accomplish this.
ALTER TABLE ZipCodes ADD SpatialData geography
We should now have a table that looks like below:
Inserting the data into the SpatialData column can be time consuming if you have a lot of records. The best way I have figured out how to do this is to use a basic UPDATE statement. Below is my script I have created for my table for this example.
UPDATE ZipCodes SET SpatialData = 'POINT(-85.972173  31.809675)' WHERE ZipCode = 36081
UPDATE ZipCodes SET SpatialData = 'POINT(-88.053241  30.686394)' WHERE ZipCode = 36685
UPDATE ZipCodes SET SpatialData = 'POINT(-86.602739  33.621385)' WHERE ZipCode = 35173
UPDATE ZipCodes SET SpatialData = 'POINT(-86.265837  32.35351)' WHERE ZipCode = 36106
UPDATE ZipCodes SET SpatialData = 'POINT(-87.022234  32.41179)' WHERE ZipCode = 36701
UPDATE ZipCodes SET SpatialData = 'POINT(-86.102689  33.43451)' WHERE ZipCode = 35161
UPDATE ZipCodes SET SpatialData = 'POINT(-87.571005  33.209003)' WHERE ZipCode = 35402
UPDATE ZipCodes SET SpatialData = 'POINT(-86.584979  34.729135)' WHERE ZipCode = 35801
UPDATE ZipCodes SET SpatialData = 'POINT(-86.007172  34.014772)' WHERE ZipCode = 35901
UPDATE ZipCodes SET SpatialData = 'POINT(-86.809484  33.517467)' WHERE ZipCode = 35266
UPDATE ZipCodes SET SpatialData = 'POINT(-86.300629  32.38012)' WHERE ZipCode = 36124
UPDATE ZipCodes SET SpatialData = 'POINT(-86.977029  34.60946)' WHERE ZipCode = 35602
UPDATE ZipCodes SET SpatialData = 'POINT(-85.239689  31.941565)' WHERE ZipCode = 36072
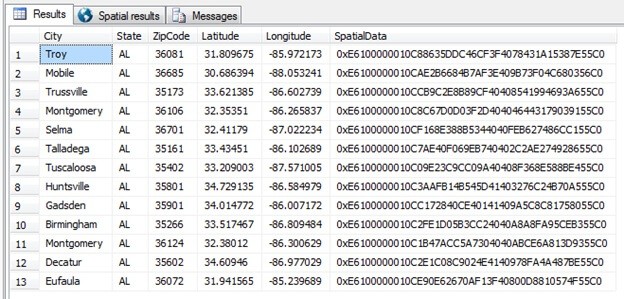
Once you update your table with the spatial data and run SELECT * FROM ZipCodes you should see the following output:
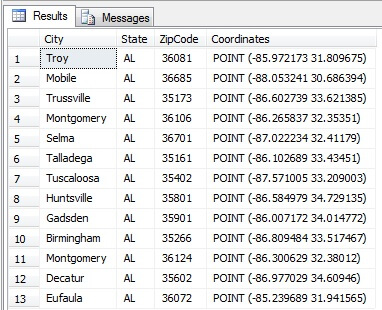
If you want to convert the SpatialData from binary back into the text you can use the CONVERT function:
SELECT City, State, ZipCode, CONVERT(varchar(255), SpatialData) AS Coordinates
FROM ZipCodes
Now that we have all of our data in our table it's time to create our map.
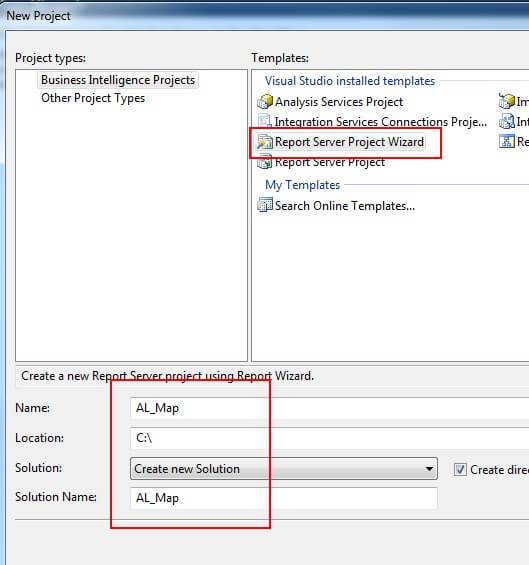
Open Business Intelligence Development Studio and create a new project by going to File, New Project. Under Visual Studio installed templates choose Report Server Project Wizard and choose a Name and Location for your project.
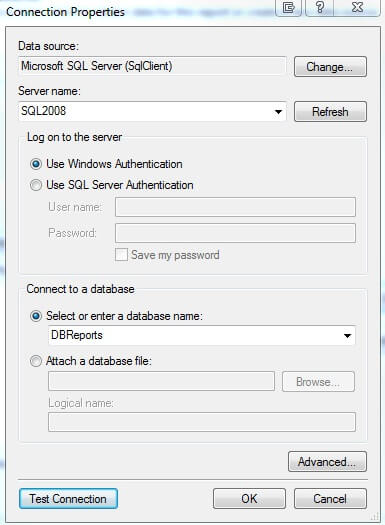
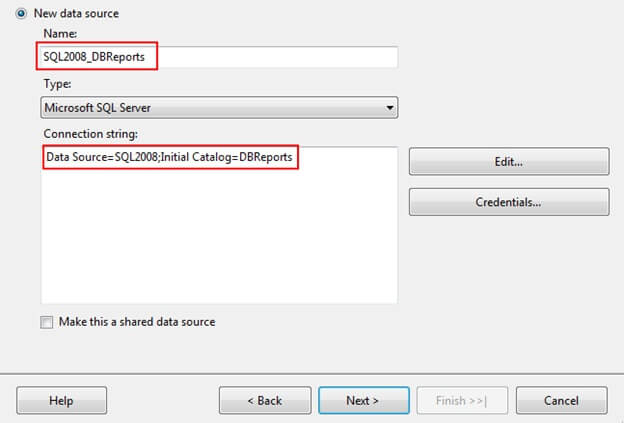
After clicking OK, the Report Wizard will appear. Click Next at the main screen and then you'll need to configure the data source. Since my table was created on SQL2008, I will use this server and the database DBReports as my data source. To configure, choose Edit... and fill in the connection properties and click Test Connection. Once the connection is successful click OK. Rename the data source and click Next.
On the design query screen use the following query and click Next:
SELECT * FROM ZipCodes
Select the Tabular Report Type and click Next, Next, Next.
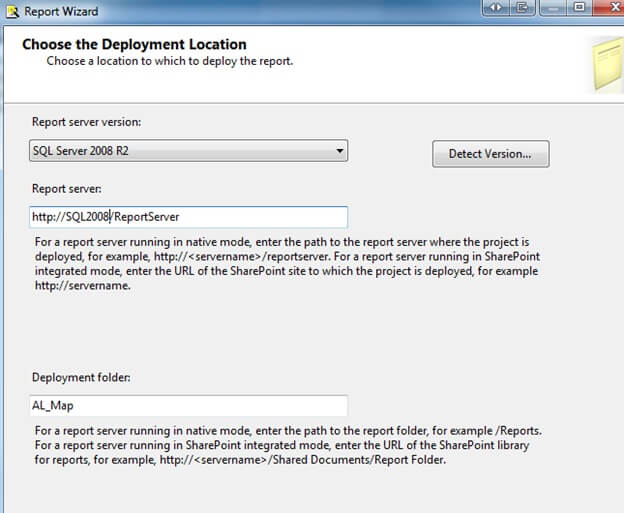
On the Deployment Location screen I'll leave the defaults and click Next.
Once we are at the Summary Screen, name the report and click Finish. This should bring up the design screen. Once in the design screen go to View, Toolbox to display the Toolbox.
In the toolbox, click the Map icon and click anywhere on the report design screen and the New Map Layer box should appear.
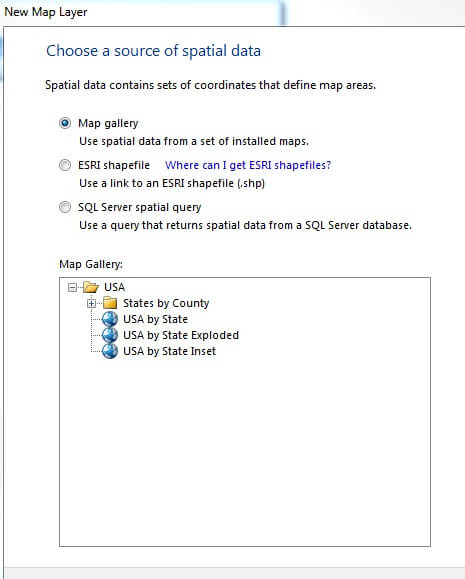
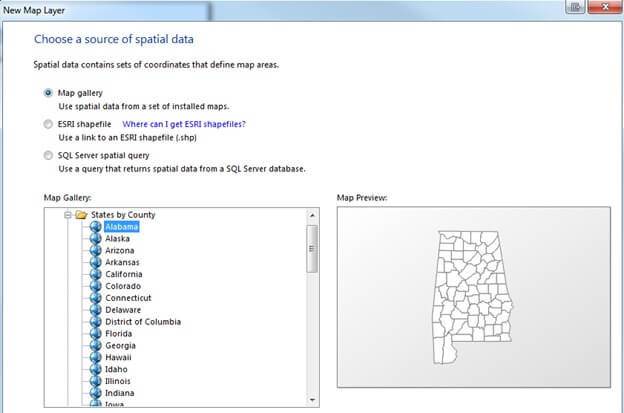
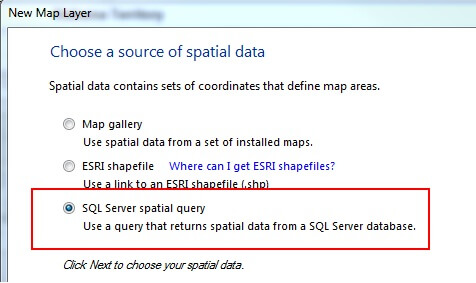
In the Map Layer Box there are a few options including Map gallery, ESRI shapefile, or SQL Server spatial query. The first layer we'll create will be the basic map layer. I'll choose Map gallery and drilldown states by county and select Alabama.
Click Next where it will display the state of Alabama and it's outlined counties. Here you can add a Bing Map layer if needed and select a Map resolution. Click Next.
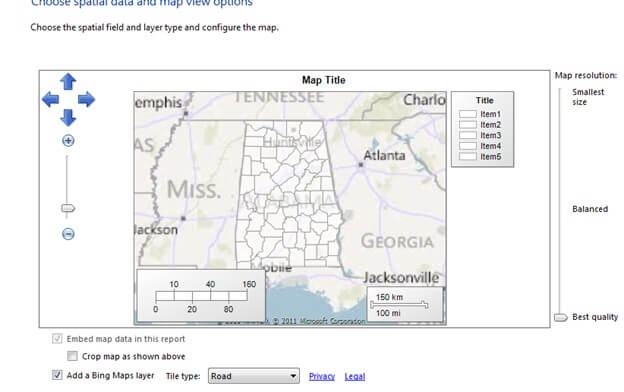
The next screen will display map visualizations. Here you can select Basic Map, Color Analytical Map, or Bubble Map. For this example, I'll choose Basic Map.
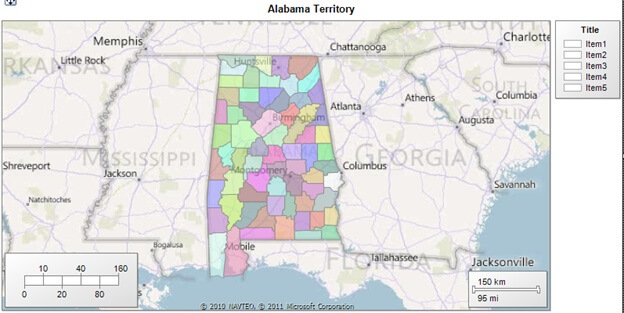
Next screen will let you choose a theme, single color map, and give you the option to display labels such as county names. Once you are finished customizing your map click Finish.
Next I usually click on the map and scale it to the size I want for display and change the Map Title at the top to an appropriate title.
Once you have the map the way you want it you will need to add another layer for the zip codes. To do this right click on the map and select Add Layer. Our New Map Layer box should appear again. This time we'll choose SQL Server spatial query and click Next.
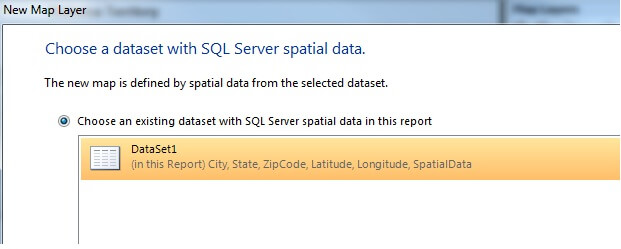
Choose the existing dataset and click Next
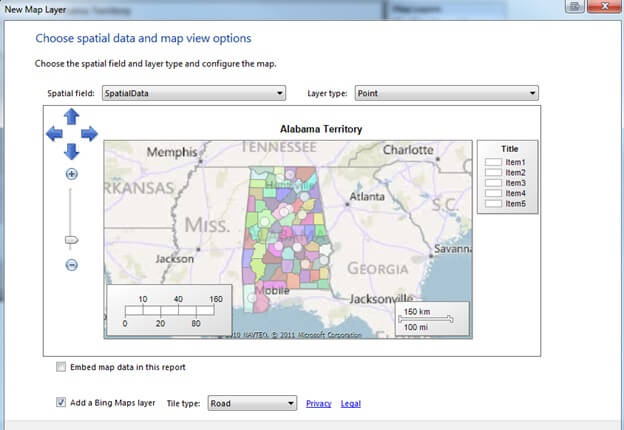
Here you will you see your pinpoints that were specified in the database table. You can also change the layer type if needed. Click Next to choose a map visualization.
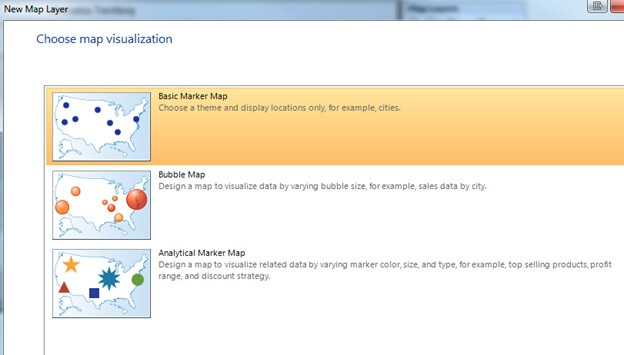
Once on the map visualization screen you can choose a Basic MarkerMap, Bubble Map, or Analytical Map. For this example I'll choose Basic Marker Map because I just want to mark my zip codes.
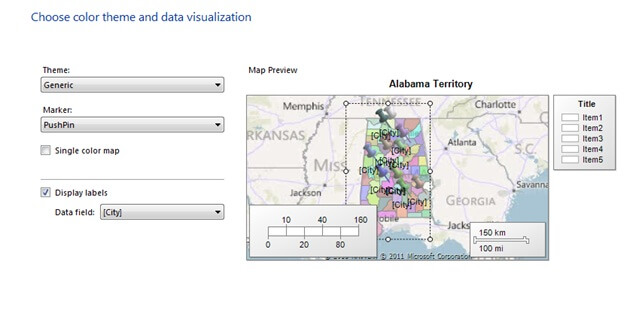
The next screen will allow you to choose a Theme, Marker, specify a single/multicolor map and display labels based on your dataset. I'll choose Generic Theme, PushPin marker, and display labels based on City. Click Finish.
Once back, you will be in design view, click Preview to preview the report.
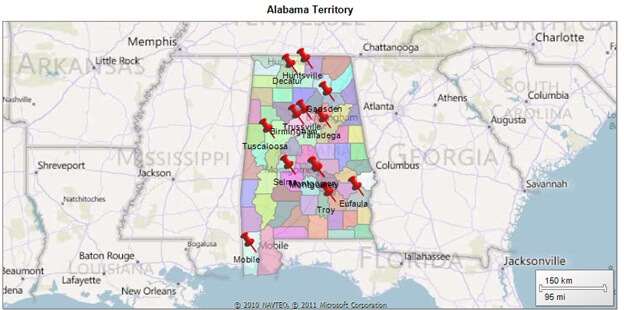
Once you're map is the way you like it, right click the .rdl in Solution Explorer and Deploy.
Next Steps
- To find Spatial data storage tips click here
- To find out more regarding the geography data type check out this tip by Tim Cullen
- Thank you to GPSVisualizer for there help in gathering geocodes


About the author
 Brady Upton is a Database Administrator and SharePoint superstar in Nashville, TN.
This author pledges the content of this article is based on professional experience and not AI generated.
View all my tips
