


I have some continuous and discrete data that i want cluster them, when I clustered these data the range numbers of state in shading variable of cluster diagram don't show correct range of my data, for example when I have range data for an attribute min=1 and max=718 but after cluster show out of this range in cluster diagram, I do not know what to do to fix this problem.
By: Dallas Snider | Comments (5) | Related: > Analysis Services Development
Problem
Where can one find a simple example utilizing the data mining clustering capabilities in SQL Server Analysis Services?
Solution
The solution presented here creates a two dimensional data table with clearly observable clusters. Next, this data is read into the clustering algorithm in SSAS where the clusters can be determined and then displayed.
The first step is to create a table and load it with data using the T-SQL sample below.
CREATE TABLE [dbo].[tblClusterExample](
pkClusterExample int identity (1,1) primary key,
[AttributeX] [decimal](18, 4) NOT NULL,
[AttributeY] [decimal](18, 4) NOT NULL
) ON [PRIMARY]
GO
insert into dbo.tblClusterExample values (rand()/10 +0.8, rand()/10 +0.8)
insert into dbo.tblClusterExample values (rand()/10 +0.2, rand()/10 +0.8)
insert into dbo.tblClusterExample values (rand()/10 +0.2, rand()/10 +0.2)
insert into dbo.tblClusterExample values (rand()/10 +0.8, rand()/10 +0.2)
go 10000
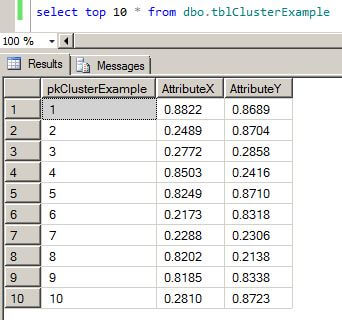
select top 10 * from dbo.tblClusterExample
The output from the T-SQL code is shown below. This data will be used as the input for the data mining algorithm.
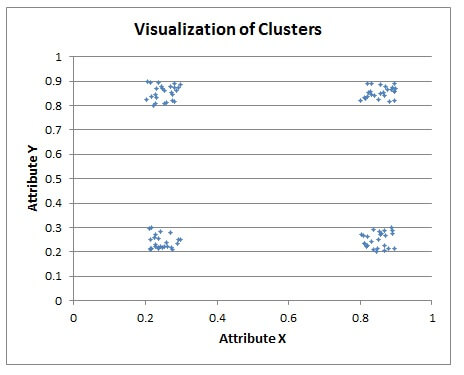
The image below is a plot made from sampling 100 points generated by the T-SQL code above. The four clusters are clearly defined in the corners of the plot.
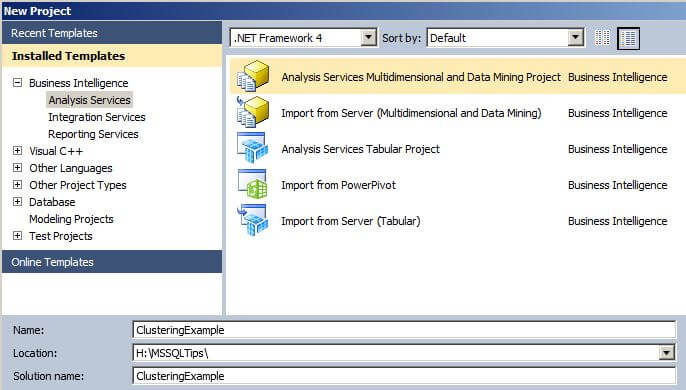
In Visual Studio, create a new Analysis Services Multidimensional and Data Mining Project. In this tip, we will name the project ClusteringExample. Click on OK when finished with the New Project window.
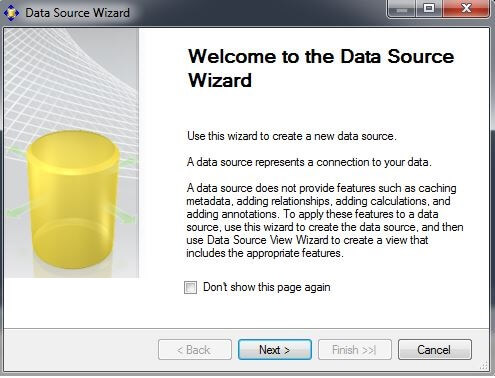
In the Solution Explorer window, right-click on the Data Sources folder and choose "New Data Source..." to initiate the Data Source Wizard. Click on "Next".
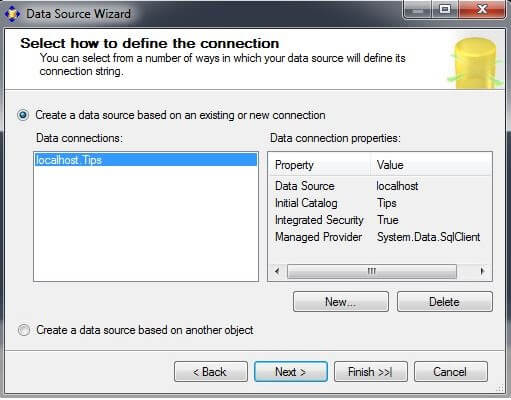
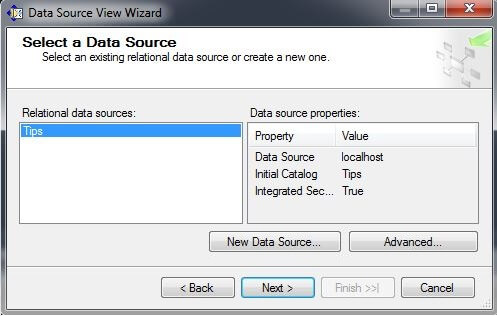
Choose your data connection, if one exists. If a Data connection does not exist, click on "New..." to create a new data connection. In this example, we are using a connection to the Tips database on the localhost. Click on "Next".
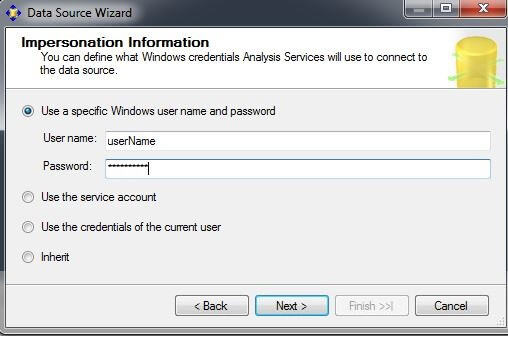
On the Impersonation Information screen, click on "Use a specific Windows user name and password." Enter your username and password. Click on "Next".
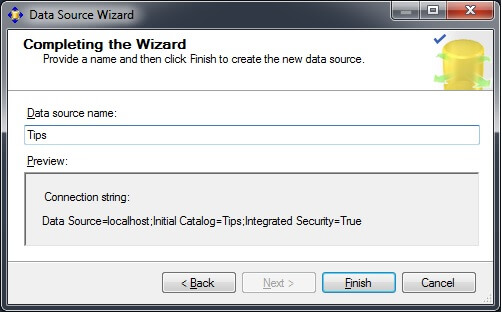
On the Completing the Wizard screen, the data source name can be changed if desired. Click on "Finish".
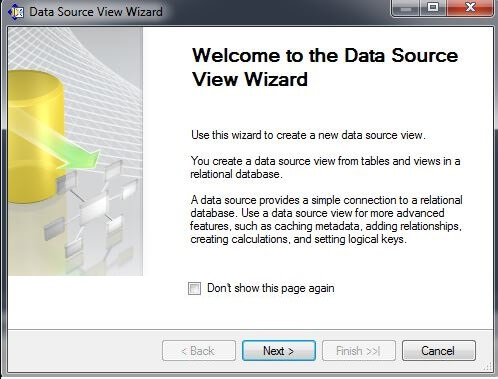
In the Solution Explorer window, right-click on the Data Source Views folder and choose "New Data Source View..." to launch the Data Source View Wizard. Click on "Next".
On the Select a Data Source page in the Relational data sources window, select the data source we created in the above step. Click on "Next".
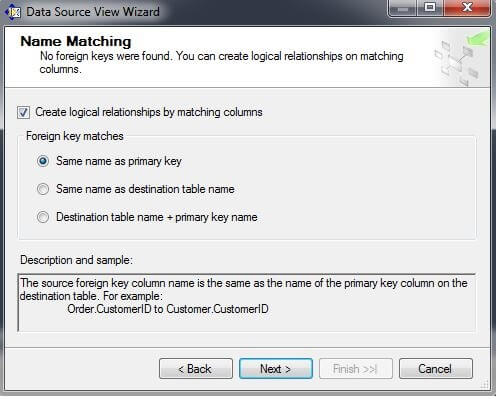
On the Name Matching page, check the box for "Create logical relationships by matching columns." In the Foreign key matches box, press the "Same name as primary key" button. Click on "Next".
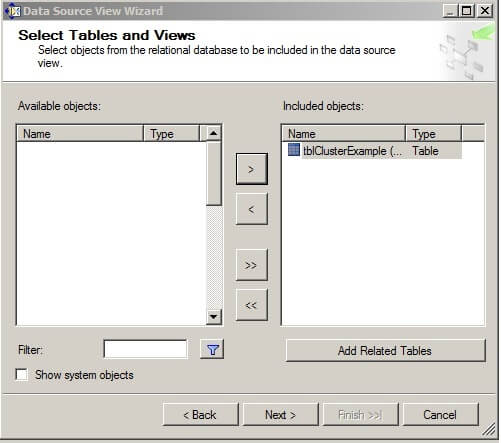
On the Select Tables and Views page, move tblClusterExample from the Available Objects box to the Included object box by selecting tblClusterExample in the Available objects box and then clicking on the ">" box. Click on "Next".
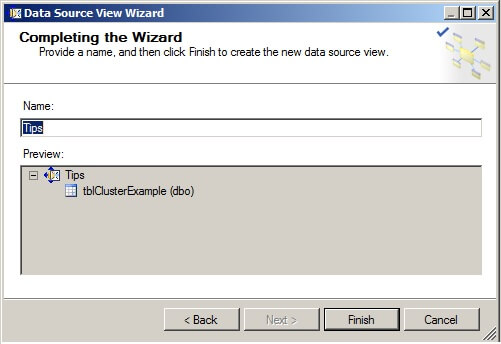
On the Completing the Wizard page, give the Data Source View a name and click on "Finish".
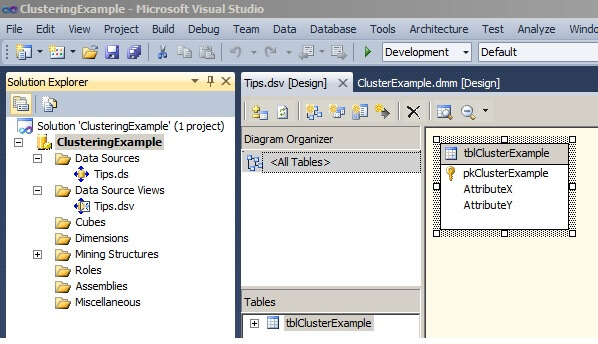
The Solution Explorer should appear as it does below with one Data Source and one Data Source View defined.
In the Solution Explorer window, right-click on the Mining Structures folder and choose "New Mining Structure..." to launch the Data Mining Wizard. Click on "Next".
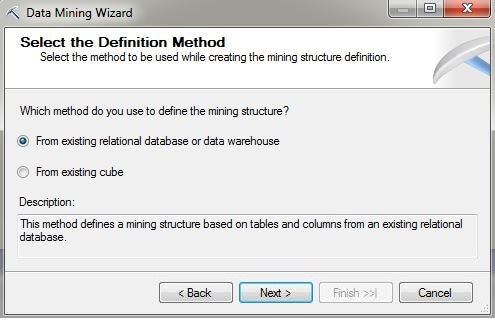
On the Select the Definition Method page, press the radio button labeled "From existing relational database or data warehouse". Click on "Next".
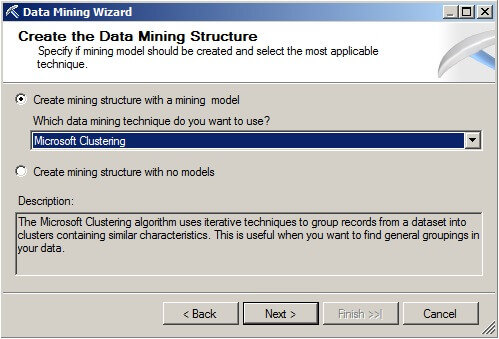
On the Create the Data Mining Structure page, press the radio button labeled "Create mining structure with a mining model". Choose the "Microsoft Clustering" data mining technique from the drop-down box.
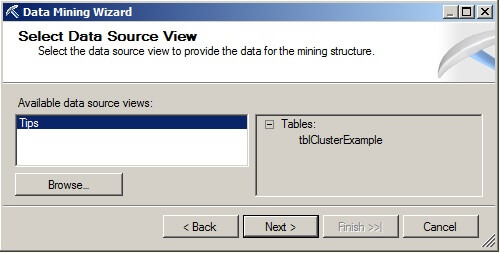
On the Select Data Source View page, choose "Tips" from the Available data source views. Please note this is the data source view we created earlier. Click on "Next".
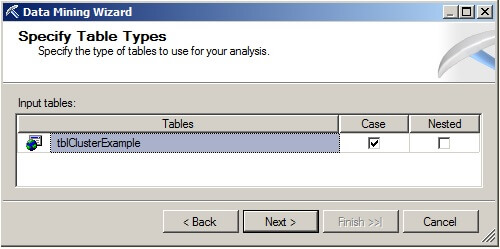
On the Specify Table Types page, make sure the Case box is checked and the Nested box is unchecked for the table named tblClusterExample.
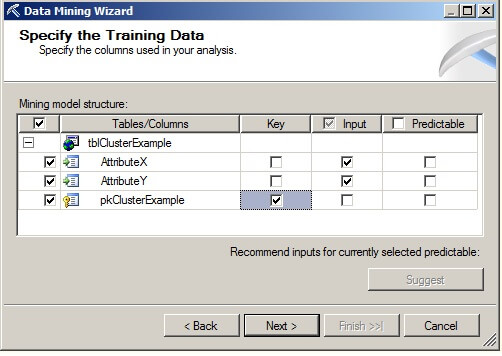
On the Specify the Training Data page, in the Key column check the box that corresponds to the pkClusterExample column. In the Input column, check the boxes for the AttributeX and AttributeY columns. These two columns will be used as input to the clustering algorithm. Because clustering is an example of unsupervised learning where the prediction of a class label is not of concern, there will be no columns checked in the Predictable column. Click on "Next".
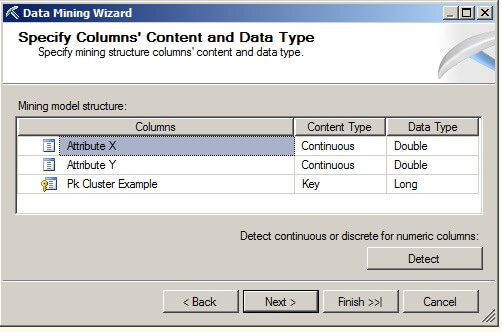
On the Specify Columns' Content and Data Type page, we see the columns to be used in the mining model structure, along with their content and data types. Click on "Next".
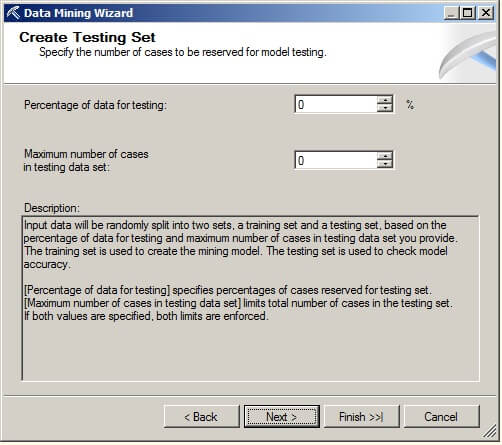
On the Create Testing Set page, we will set the "Percentage of data for testing" and "Maximum number of cases in testing data set" to zero for this example. Please note that there needs to be a set of data reserved for testing or use 10-fold cross validation to prevent over fitting the data mining model to the training data. Click on "Next".
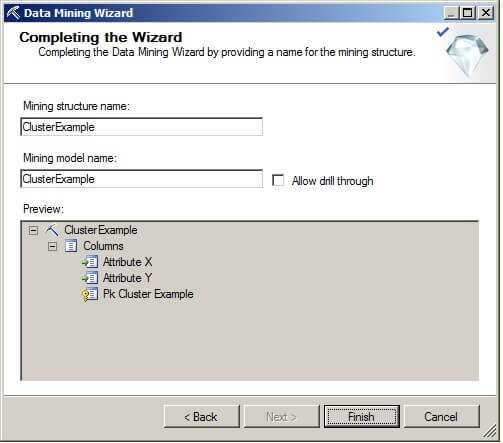
On the Completing the Wizard page, the name of the mining structure and model can be changed. Click on "Finish".
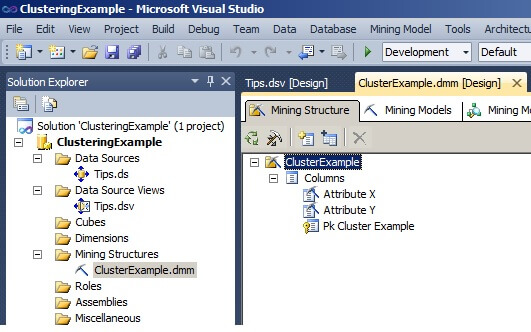
The image below shows the Visual Studio Solution Explorer window and the Mining Structure tab of the data mining model that was created in the steps above.
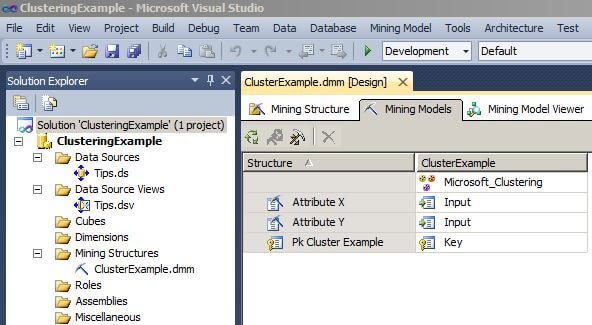
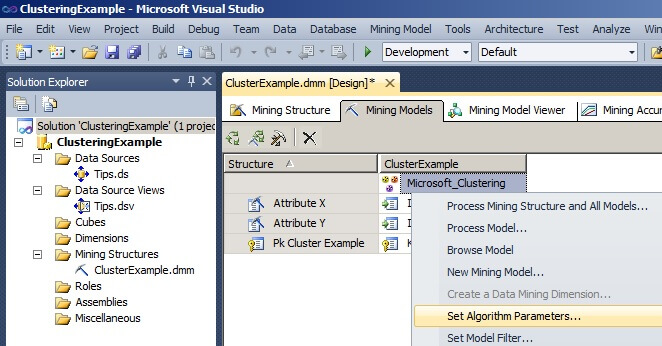
The next image from Visual Studio shows the Mining Models tab of the data mining model that was created in the steps above.
Under the Mining Model tab, right click on the box labeled "Microsoft_Clustering" to bring up the menu shown below and select "Set Algorithm Parameters..." to display the Algorithm Parameters window.
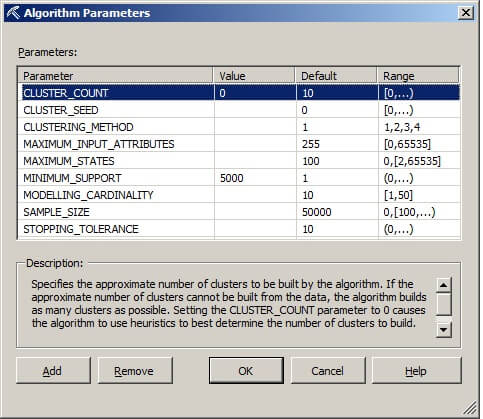
In the Algorithm Parameters window, set CLUSTER_COUNT to 0 and MINIMUM_SUPPORT to 5000. Setting the CLUSTER_COUNT to zero will force the algorithm to determine the optimum number of clusters which can be beneficial when exploring new sets of data. If the MINIMUM_SUPPORT value is set too low or to the default, then the algorithm will generate more than the four clusters desired for our example dataset. The description box explains the meanings of the parameters and their values.
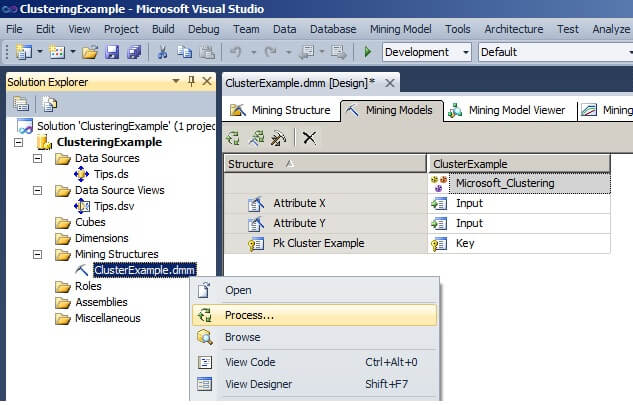
The next few images show the process of building, deploying, and processing the data mining model on the SQL Server Analysis Services server from the Visual Studio project. In the Solution Explorer window in the Mining Structures folder, right-click on the ClusteringExample.dmm mining structure and choose "Process..."
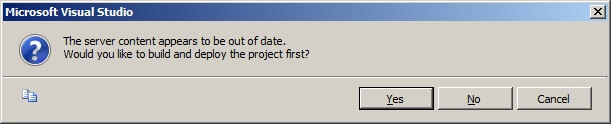
When asked "Would you like to build and deploy the project first?", choose "Yes". If prompted to enter the password for your data source, please do so.
In the Process Mining Structure window, leave the default values and click on "Run...".
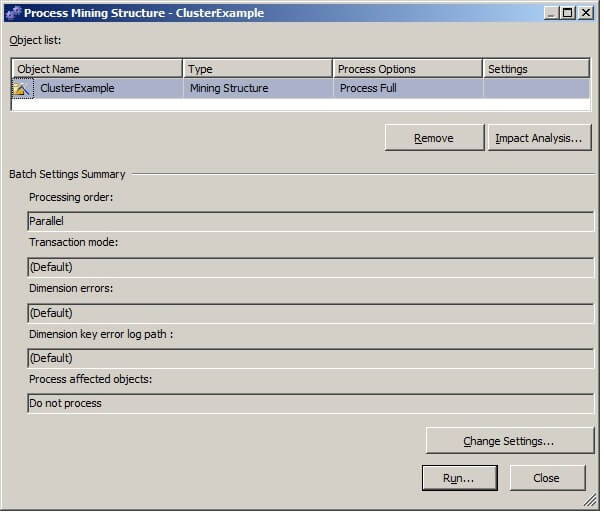
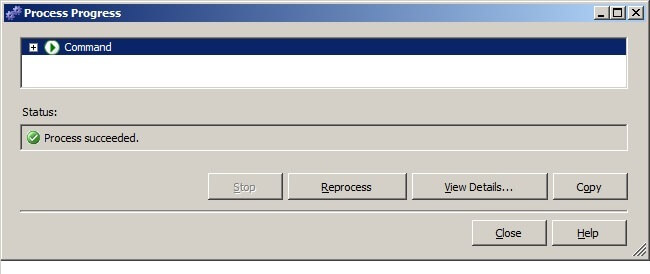
The Process Progress window should appear while the cluster algorithm is running and the data mining structures are built and deployed. When the status is "Process succeeded", click on "Close" to go back to the Process Mining Structure window. Click on "Close" again to return to the Visual Studio window.
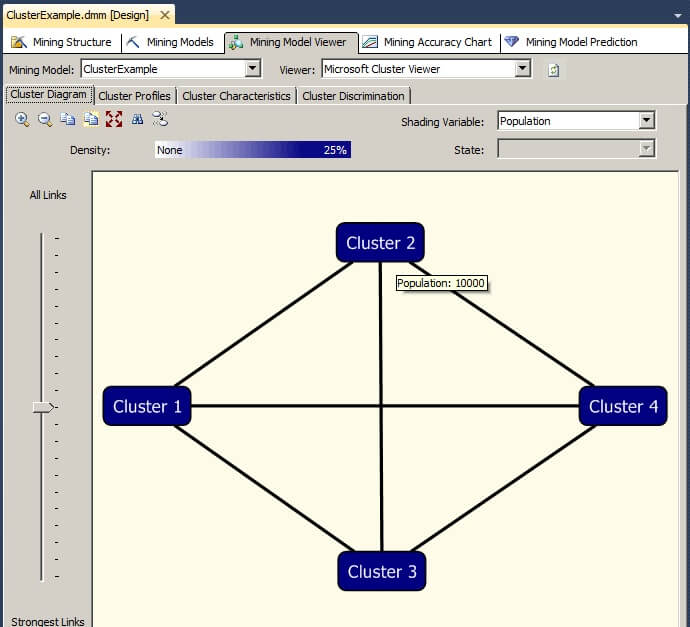
Click on the Mining Model Viewer tab and click on the Cluster Diagram tab. The clusters will display on the screen. Hovering the mouse pointer over the rectangular cluster objects will pop-up an informational box showing the population of the cluster.
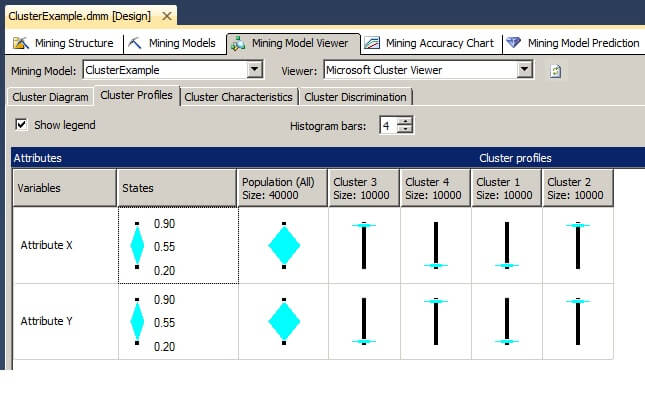
Clicking on the Cluster Profiles tab of the Mining Model Viewer reveals the population of each cluster and the overall population.
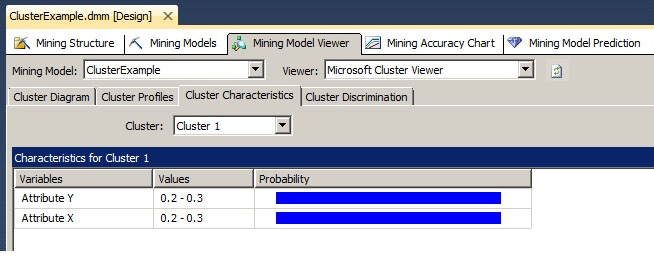
Clicking on the Cluster Characteristics tab of the Mining Model Viewer shows the properties of one cluster or all of the clusters.
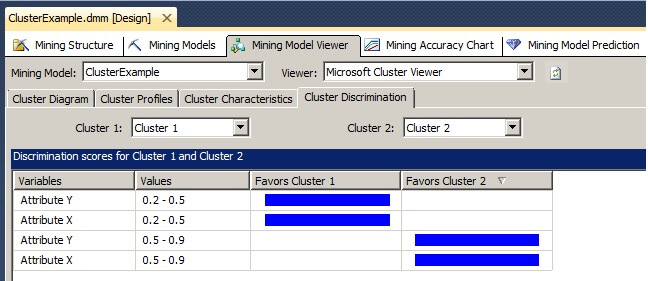
Clicking on the Cluster Discrimination tab of the Mining Model Viewer allows for the comparison of the composition of any two clusters.
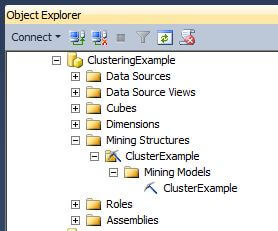
The image below is taken from the Object Explorer window for Analysis Services in SQL Server Management Studio after deployment and processing. Notice how the objects displayed here match the objects seen in the Solution Explorer window within Visual Studio.
Next Steps
- After completing the above tip, adjust the parameters and their values to see how the clusters change.
- Please refer to the following tips for further assistance with SQL Server Analysis Services:
About the author
 Dr. Dallas Snider is an Assistant Professor in the Computer Science Department at the University of West Florida and has 18+ years of SQL experience.
This author pledges the content of this article is based on professional experience and not AI generated.
View all my tips
