By: Derek Colley | Comments (13) | Related: > Performance Tuning
Problem
You are tasked with examining poor performance for queries on a certain table, or range of tables. Perhaps a sales report is timing out or running unacceptably slow; perhaps your web application is failing to return the result set before the application timeout is reached. You need to find out what's causing the bottleneck, and optimize either the queries used, the table schemata, or both.
Solution
This tip will show you methods to optimize a poorly-performing query, and optimize the table to maximize the performance of the query. Specific demonstrations will be on choosing the right index for the job; the investigation of the plan cache; taking advantage of simple parameterization, and partitioning the target tables for better query performance.
Please note - this article cannot possibly hope to cover these topics in depth; rather, the idea is to give you a general idea of some techniques you could use to help diagnose your own problems. At the end of the tip, I will link to relevant sources where you can find out more. Furthermore, the techniques described are by no means the only way of finding out what's going on with a problem query - this is a demo of just a few ways of tackling the problem, and I do not claim they are the best. Finally - always test first, and never run blindly on production systems!
Demonstration Build
Throughout this article, I will be using a populated table called dbo.Orders in a new database called BadQueries. You can find the build script below, which will create the database, the table, and populate it with 5,000,000 rows of lifelike order data - with gaps in the OrderID, multiple orders per customer (50k customers for 5m orders), different sites referenced by name (rather than SiteID) and a cancellation rate of 5% with an even distribution. This ran in approximately 12 minutes on an Intel Core i7 2.7GHz, 8GB RAM, with SSD storage - your mileage may vary. Data population is row-by-row due to use of side-effecting RAND() functions and a sub-query, but I'm always open to new ideas for set-based data generation code if any readers have any tips of their own!
SET NOCOUNT ON
USE master
IF EXISTS ( SELECT name FROM sys.databases WHERE name = 'BadQueries' )
 DROP DATABASE BadQueries
CREATE DATABASE BadQueries
ON PRIMARY
 ( NAME = 'BadQueries_main', FILENAME = 'C:\DEL\BadQueries_main.mdf', SIZE = 100MB )
LOG ON
 ( NAME = 'BadQueries_log', FILENAME = 'C:\DEL\BadQueries_log.ldf', SIZE = 50MB )
GO
USE BadQueries
GO
CREATE TABLE dbo.Orders (
 OrderID INT NOT NULL,
 OrderTimestamp DATETIME NOT NULL,
 SiteName VARCHAR(20) NULL,
 CustomerID INT,
 OrderValueNoVAT NUMERIC(16,2) NOT NULL DEFAULT 0.00,
 VATValue AS ROUND(OrderValueNoVat * 0.2, 2),
 OrderCancelled BIT NOT NULL DEFAULT 0 )
DECLARE @MaxLogEntries INT = 5000000 -- how many rows do we want?
DECLARE @Counter INT = 1
DECLARE @ThisTimeStamp DATETIME
DECLARE @TimeStampSeed DATETIME = '2001-01-01 09:00:00'
DECLARE @Sites TABLE ( UQID INT, SiteName VARCHAR(20) )
INSERT INTO @Sites
 SELECT 1, 'Wolverhampton' UNION
 SELECT 2, 'Burnley' UNION
 SELECT 3, 'Brighton'
WHILE @Counter <= @MaxLogEntries
BEGIN
 SET @ThisTimeStamp = DATEADD(MILLISECOND,(ROUND(RAND() * 1000000,2)),@TimeStampSeed)
 -- selects next random timestamp from last t/s to last t/s + 1000sec
 INSERT INTO dbo.Orders
  (OrderID, OrderTimeStamp, SiteName, CustomerID,
   OrderValueNoVAT, OrderCancelled)
  SELECT
   @Counter + 1000 + ( ROUND( RAND() * 2, 0) ),
   -- this will provide OrderIDs with occasional gaps
   @ThisTimeStamp, -- the newly-generated timestamp
   (  SELECT SiteName
    FROM @Sites
    WHERE ( FLOOR(RAND() * 9.99) + 1 = UQID ) ),
   ROUND(RAND() * (@MaxLogEntries / 100),0),
   -- 50k unique customers for 5m orders
   ROUND(RAND() * 500, 2),
   -- random $/ amount for the order, up to 500.00
   0 -- the order isn't cancelled, by default.
 -- reset vars and redo
 SET @TimeStampSeed = @ThisTimeStamp
 SET @Counter += 1
END
-- now cancel 1 in 20 orders for realism
 UPDATE dbo.Orders
 SET OrderCancelled = 1
 WHERE OrderID % 20 = 0
So, now we must define a query to test. Review the query below, which answers the following use case:
"As a company accountant based in Wolverhampton, I need to view a summary of orders made from the Wolverhampton store grouped by individual customer, for a defined one-month period, that must include the grand total of the order values per customer including VAT, the average value of each order placed by each customer including VAT, and the number of orders each customer placed. I do not want cancelled orders included in the summary."
SELECT  o.CustomerID,
  SUM(o.OrderValueNoVAT + o.VATValue) [GrandTotal],
  ROUND(AVG((o.OrderValueNoVAT + o.VATValue)),2) [AverageOrderValueIncVAT],
  COUNT(*) [Num_Of_Orders]
FROM  dbo.Orders o
WHERE  o.OrderCancelled = 0
AND  o.OrderTimeStamp BETWEEN '2012-03-01' AND '2012-03-31'
AND  o.SiteName = 'Wolverhampton'
GROUP BY o.CustomerID
ORDER BY SUM(o.OrderValueNoVAT + o.VATValue) DESC
Query Analysis
Running this query as shown above yields the result set required to meet the use case. If we select Actual Execution Plan, and SET STATISTICS IO ON; SET STATISTICS TIME ON; before we run the query, we can also get some meaningful statistics to help us determine what could be improved. Let's first see how long it took to run. We'll run from a cold buffer cache too, and empty the procedure cache before each execution to ensure the previous plan isn't reused (Important! DO NOT do this on your production server!).
DBCC DROPCLEANBUFFERS
DBCC FREEPROCCACHE
SET STATISTICS IO ON
SET STATISTICS TIME ON
Here's the results on my database instance:
SQL Server parse and compile time: CPU time = 10 ms, elapsed time = 10 ms.
SQL Server Execution Times: CPU time = 2293 ms, elapsed time = 669 ms.
669ms to execute is a long time for a simple aggregate query. CPU time refers to the amount of time the query spent on the CPU. If there are multiple CPUs (or your MAXDOP setting is > 1, or 0) then this doesn't mean 'how long did the query take to execute' but 'how much time, when combined, did it spend on all CPUs'.
Let's re-run the query, clearing the caches first, and restrict MAXDOP to 1 - with such a straightforward query, we can test whether it would be beneficial to commandeer just one scheduler rather than the 4 I have available. This will simplify the query distribution and hopefully prevent the overhead incurred from coordinating all workers from multiple CPUs. Note that with larger or more complex scenarios, exactly the opposite may apply, where multi-threading will improve performance. Here are the results when MAXDOP is forced to 1:
SQL Server parse and compile time: CPU time = 0 ms, elapsed time = 7 ms.
SQL Server Execution Times: CPU time = 468 ms, elapsed time = 520 ms.
Immediately we can see the benefit of restricting to just one CPU thread - total elapsed time is 527ms. There's also significantly less time spent on the CPU, freeing up resources for other threads. Now let's take a look at I/O - turn on SET STATISTICS IO ON and turn off SET STATISTICS TIME OFF. Now flush the procedure and buffer cache again, and re-run the query (leaving MAXDOP 1 in place). Here's the I/O statistics result:
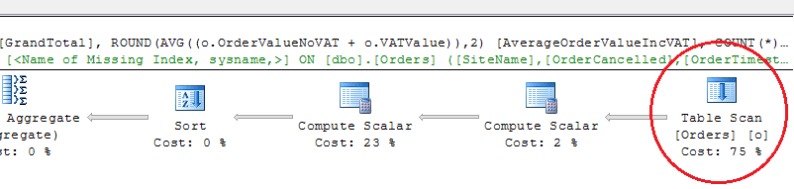
Table 'Orders'. Scan count 1, logical reads 25288, physical reads 0, read-ahead reads 25262, lob logical reads 0, lob physical reads 0, lob read-ahead reads 0.
This is a large number of reads to return just 494 rows (your result may vary slightly). Let's take a look at the execution plan, and see what's going on. Here's part of the execution plan, a table scan on dbo.Orders, that accounts for more than 80% of the load. Note the missing index warning too.
Indexing
We can reduce the I/O consumption and make the query execute faster by adding an index, as at present dbo.Orders is a heap. Looking at the query, we can see the CustomerID, OrderValueNoVAT and VATValue are the only columns returned in some form by the SELECT - the rest are transformations or aggregations on the columns, with the possible exception of COUNT(*). Our initial thought should be, 'Why put a clustered index on OrderID if it's not being used in the query?' One would think that for this query a clustered index, while generally beneficial, may not directly benefit the query execution time since it will move the data from sequential pages ordered by the order of original insertion into a b-tree format ordered by OrderID, with no relation to the query.
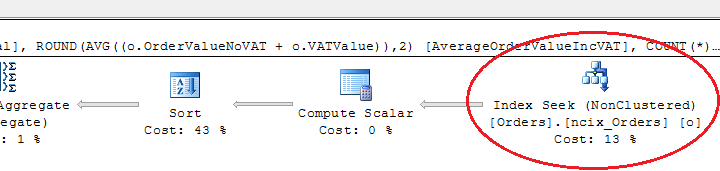
Let's add the non-clustered index, free the caches again, re-run the query, and take a look at the I/O stats. The index creation criteria are decided by the columns used in the SELECT and WHERE - the columns in the WHERE form the core of the index, with the columns in the SELECT forming the covered columns in INCLUDE:
CREATE NONCLUSTERED INDEX ncix_Orders ON dbo.Orders
 ( SiteName, OrderCancelled, OrderTimeStamp )
 INCLUDE ( CustomerID, OrderValueNoVAT, VATValue)
UPDATE STATISTICS dbo.Orders
(clear the caches, turn SET STATISTICS IO ON back on and rerun the query)
SQL Server parse and compile time: CPU time = 0 ms, elapsed time = 7 ms.
Table 'Orders'. Scan count 1, logical reads 8, physical reads 2, read-ahead reads 5, lob logical reads 0, lob physical reads 0, lob read-ahead reads 0.
SQL Server Execution Times: CPU time = 0 ms, elapsed time = 76 ms.
This is an excellent result - not only have we brought down the query execution time to 83ms total, we have slaughtered the number of reads required. Let's add a clustered index (and primary key by inference) on OrderId to see if this makes a difference, or adds overhead to the query processing:
CREATE CLUSTERED INDEX cix_Orders on dbo.Orders ( OrderId )
UPDATE STATISTICS dbo.Orders
SQL Server parse and compile time: CPU time = 0 ms, elapsed time = 8 ms.
Table 'Orders'. Scan count 1, logical reads 8, physical reads 2, read-ahead reads 5, lob logical reads 0, lob physical reads 0, lob read-ahead reads 0.
SQL Server Execution Times: CPU time = 15 ms, elapsed time = 76 ms.
SQL Server parse and compile time: CPU time = 0 ms, elapsed time = 0 ms.
In fact it makes no difference at all, the clustered index is simply ignored. From the point of view of query processing, there's not much difference between using a row pointer on a leaf-level non-clustered index page to a data page in a heap and using a row pointer on a leaf-level non-clustered index page to a data page in a clustered index - there's still one lookup required for every read. If this was the only query on this table, then we have provided a rare case when a heap is equivalent, or arguably even better, than a clustered index.
Caching and Parameterization
What else can we do to improve performance? Let's imagine this query is part of a Reporting Services solution and the start and end dates on which OrderTimeStamp is queried are variable, but sent through to the database engine as hardcoded values. Let's first look in the procedure cache to see if we can see our query:
SET STATISTICS IO OFF
SET STATISTICS TIME OFF
SELECT  p.usecounts, size_in_bytes, cacheobjtype, objtype, t.[text]
FROM   sys.dm_exec_cached_plans p
CROSS APPLY sys.dm_exec_sql_text(p.plan_handle) t
WHERE   t.[text] LIKE '%dbo.Orders%'
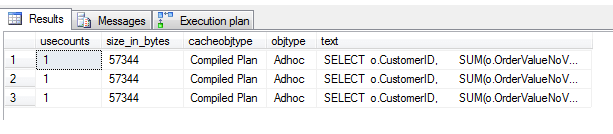
Here's the result.
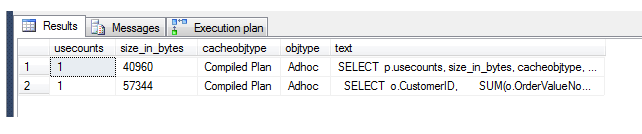
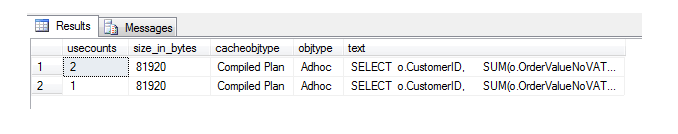
You can see the second row is the record of the single execution of the query since the last procedure cache flush. Let's now alter the OrderTimeStamp criteria in the WHERE clause and rerun the query with different dates, and we'll see if a different plan appears in the plan cache rather than reusing the same one. If you make the date change and execute the amended query twice, you'll see the first (original) query plan in there once, and the amended version in there with 2 usecounts (total 3 executions):
(run query, changing the following:)
AND o.OrderTimeStamp BETWEEN '2011-03-01' AND '2011-03-31'
Now run:
SELECT  p.usecounts, size_in_bytes, cacheobjtype, objtype, t.[text]
FROM   sys.dm_exec_cached_plans p
CROSS APPLY sys.dm_exec_sql_text(p.plan_handle) t
WHERE   t.[text] LIKE '%dbo.Orders%'
AND  t.[text] NOT LIKE ('%SELECT%p.usecounts%') -- eliminates this query
So does storing the plan in cache make any difference? Let's turn statistics back on for I/O and time, and re-run the amended query (without flushing the caches first) to find out:
SQL Server parse and compile time: CPU time = 0 ms, elapsed time = 0 ms.
SQL Server Execution Times: CPU time = 0 ms, elapsed time = 23 ms.
SQL Server parse and compile time: CPU time = 0 ms, elapsed time = 0 ms.
Yes, it does - we're now down to 23ms. But is there anything ELSE we can do to improve the query transaction time? Well, we've established that running the query from cold caches more than triples the total execution time (23ms vs. 83ms). But what happens if this query is part of the aforesaid Reporting Services solution or has some other interface that allows manipulation of the dates? Every unique query execution will have it's own plan!
Let's attempt to force parameter sniffing on the query. There's a couple of ways we can do this - we can put the query inside a stored procedure, and the optimizer will sniff the parameters and reuse the same plan through 'SIMPLE' parameterization. Alternatively we can use the query hint 'OPTIMIZE FOR' on the end of the query, but note we can't force SIMPLE or FORCED parameterization here. Add OPTIMIZE FOR (UNKNOWN) to the OPTION (MAXDOP 1) as follows - your query should look like the below. Then flush the caches and execute the query three times with three sets of values for OrderTimeStamp, before querying the plan cache:
SELECT  o.CustomerID,
  SUM(o.OrderValueNoVAT + o.VATValue) [GrandTotal],
  ROUND(AVG((o.OrderValueNoVAT + o.VATValue)),2) [AverageOrderValueIncVAT],
  COUNT(*) [Num_Of_Orders]
FROM  dbo.Orders o
WHERE  o.OrderCancelled = 0
AND  o.OrderTimeStamp BETWEEN '2012-03-01' AND '2012-03-31'
AND  o.SiteName = 'Wolverhampton'
GROUP BY o.CustomerID
ORDER BY SUM(o.OrderValueNoVAT + o.VATValue) DESC
OPTION  (MAXDOP 1, OPTIMIZE FOR UNKNOWN)
(change the BETWEEN values above to different values and execute 3 times)
SELECT  p.usecounts, size_in_bytes, cacheobjtype, objtype, t.[text]
FROM   sys.dm_exec_cached_plans p
CROSS APPLY sys.dm_exec_sql_text(p.plan_handle) t
WHERE   t.[text] LIKE '%dbo.Orders%'
AND  t.[text] NOT LIKE ('%SELECT%p.usecounts%') -- eliminates this query
As you can see, this wasn't successful. Separate plans were created for each execution despite the only difference being the OrderTimeStamp dates. The reason for this is that the start date and end date are not variables - they are hardcoded values. We could look at using a template plan guide coupled with forced parameterization, but setting up the plan guide is unfortunately beyond the scope of this article - see Next Steps for further information on plan guides. To use SIMPLE parameterization outside the scope of a stored procedure, we should just have to substitute our hardcoded values for @variables and get rid of our OPTIMIZE FOR statement - let's do this now.
Create a temporary table to store our hardcoded values. When optimizing your queries, this can be supplied by the calling application - e.g. SSIS uses variables in a similar way - or you can keep a config area set aside in your database. Change the main query to call the value from the temporary table.
DBCC FREEPROCCACHE
DBCC DROPCLEANBUFFERS
CREATE TABLE #ConfigVariables ( StartDate DATE, EndDate DATE, SiteName VARCHAR(20) )
INSERT INTO #ConfigVariables VALUES('2012-03-01', '2012-03-31', 'Wolverhampton')
SELECT  o.CustomerID,
  SUM(o.OrderValueNoVAT + o.VATValue) [GrandTotal],
  ROUND(AVG((o.OrderValueNoVAT + o.VATValue)),2) [AverageOrderValueIncVAT],
  COUNT(*) [Num_Of_Orders]
FROM  dbo.Orders o, #ConfigVariables cv
WHERE  o.OrderCancelled = 0
AND  o.OrderTimeStamp BETWEEN cv.StartDate AND cv.EndDate
AND  o.SiteName = cv.SiteName
GROUP BY o.CustomerID
ORDER BY SUM(o.OrderValueNoVAT + o.VATValue) DESC
OPTION  (MAXDOP 1, OPTIMIZE FOR UNKNOWN)
Now in a separate batch, run this to increment the StartDate and EndDate values by 1 year:
UPDATE #ConfigVariables SET StartDate = DATEADD(YEAR, 1, StartDate)
UPDATE #ConfigVariables SET EndDate = DATEADD(YEAR, 1, EndDate)
Do the above 5 times. You will get 5 different query results. However, when we query the plan cache, we can see we have achieved efficient reuse of the same plan. We can alter our variables any way we like - we have effectively forced plan reuse. Note that this is good for us, since our use case specifies that OrderTimestamp must have a range of 1 month, but beware when misusing parameterization like this if the variables are *too* variable! For example, if the range was extended to 1 year, the plan would be unsuited to the data since the cardinality of the estimated vs. actual statistics in the execution plan would be misaligned, and some calculation operators (like sort) might not be appropriate for the different data set. Using parameterization like this is normally suitable when the range variability of the variables is known.
Let's look at the stats (turn on STATISTICS again and rerun the main query):
SQL Server parse and compile time: CPU time = 0 ms, elapsed time = 0 ms.
Table 'Orders'. Scan count 1, logical reads 7, physical reads 0, read-ahead reads 0, lob logical reads 0, lob physical reads 0, lob read-ahead reads 0.
Table '#ConfigVariables__________...______00000000000A'. Scan count 1, logical reads 1, physical reads 0, read-ahead reads 0, lob logical reads 0, lob physical reads 0, lob read-ahead reads 0.
SQL Server Execution Times: CPU time = 0 ms, elapsed time = 51 ms.
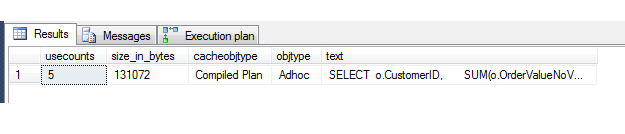
We can see the call to the temporary table, and execution time is 51ms - we've paid a price on our previous result of 23ms, but we're not doing badly. I/O is still the same, too, with reads split over the two tables. However, what we're NOT doing is filling the procedure cache full of ad-hoc plans. This will dramatically lessen the likelihood that any of our queries will need to recompile, since on a well-designed system there is plenty of cache space to accommodate them all. This has a strong positive impact on system health as a whole and helps every query fulfill its plan from cache, improving the overall performance of the system.
So what else can we do?
Partitioning
We could partition the table to recognize splits in the data that complement our query. To keep this example table more realistic, we will now imagine there are two other queries that use this table, just to complicate matters and force us to consider overall usage when planning for partitioning. Here is the first query: it is embedded in SSRS, and simply fetches some columns for the last 100 orders that haven't been cancelled, ordered by timestamp descending:
SELECT  TOP 100 o.OrderID, o.OrderValueNoVAT, o.VATValue,
  (o.OrderValueNoVAT + o.VATValue) [OrderValue]
FROM  dbo.Orders o
WHERE  o.OrderCancelled = 0
ORDER BY o.OrderTimeStamp DESC
Here's the second query. It returns a list of orders cancelled in the last 30 days valued at 50.00 or over, which the fictional customer retention team can then use to identify customers to contact and attempt to change their minds:
SELECT  o.CustomerID, o.OrderID, o.OrderValueNoVAT
FROM  dbo.Orders o
WHERE  OrderTimeStamp BETWEEN CAST(DATEADD(DAY, -30, GETDATE()) AS DATE)
    AND CAST(GETDATE() AS DATE)
AND  OrderValueNoVAT >= 50.00
AND  OrderCancelled = 1
ORDER BY OrderValueNoVAT DESC
So now we have three queries to profile, and work out if partitioning could be a good solution. Looking at our first query, we can see the @StartDate and @EndDate reference a 1-month period in our data set (approx. 30 days). The second query fetches the top 100 rows ordered by descending timestamp. The third query references a 30 day period ordered by descending timestamp. Let's illustrate the data each query accesses like so:
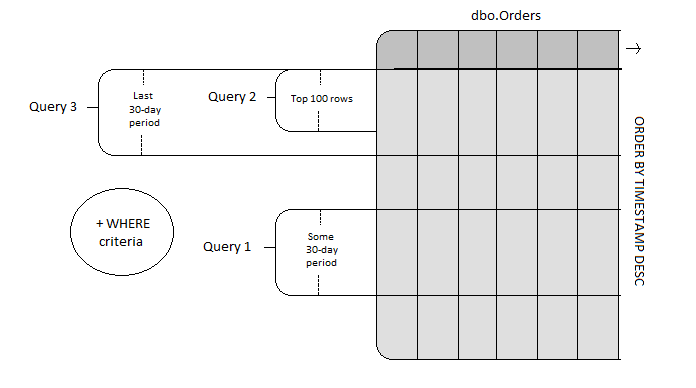
Each query has this in common - a 30 day period is referenced. The WHERE clauses do differentiate the rows that appear in the result sets, but during logical query processing the WHERE clause is evaluated after the FROM as a filtering process on the tables in the FROM clause, and it is here that a partitioned result set will be useful.
I'm going to assume the reader has some familiarity with partitioning, and present the partition function and scheme that will divide up the table into partitions by month (which approximate 30 days).
We'll use this snippet of code to cheat and create our partition function statement, since the range of dates in our test table stretches through to the year 2080(!) and encompasses around 970 months, which is too much to type out ourselves:
DECLARE @ThisDate DATE =
 ( SELECT CAST(LEFT(CONVERT(VARCHAR(10), MIN(OrderTimeStamp), 120), 7)
  + '-01' AS DATE) FROM dbo.Orders )
DECLARE @EndDate DATE =
 ( SELECT MAX(OrderTimeStamp) FROM dbo.Orders )
DECLARE @sql NVARCHAR(MAX) = '
 CREATE PARTITION FUNCTION orders_partition_function ( DATETIME )
 AS RANGE LEFT
 FOR VALUES (' + CHAR(9)
DECLARE @Counter INT = 1
WHILE @ThisDate <= DATEADD(MONTH, 1, @EndDate)
BEGIN
 SET @sql = @sql + QUOTENAME(@ThisDate,'''') + ', '
 SET @ThisDate = DATEADD(MONTH, 1, @ThisDate)
 IF @Counter % 6 = 0
  SET @sql = @sql + CHAR(13) + CHAR(10) + REPLICATE(CHAR(9), 5)
 SET @Counter += 1
END
SET @sql = LEFT(@sql, LEN(@sql) - 1) + ')'
SELECT @sql
This yields the following partition function (rightmost values off-screen):
CREATE PARTITION FUNCTION orders_partition_function ( DATETIME )
 AS RANGE LEFT
 FOR VALUES ( '2001-01-01', '2001-02-01', '2001-03-01', '2001-04-01', '2001-05-01', '2001-06-01',
   '2001-07-01', '2001-08-01', '2001-09-01', '2001-10-01', '2001-11-01', '2001-12-01',
    ...
   '2079-01-01', '2079-02-01', '2079-03-01', '2079-04-01', '2079-05-01', '2079-06-01',
   '2079-07-01', '2079-08-01', '2079-09-01', '2079-10-01', '2079-11-01', '2079-12-01',
   '2080-01-01', '2080-02-01', '2080-03-01', '2080-04-01', '2080-05-01')
Now let's define the partition scheme using the function.
CREATE PARTITION SCHEME orders_partition_scheme
AS PARTITION orders_partition_function
ALL TO ( [PRIMARY] )
Now let's both rebuild the indexes and update the statistics on the table for good measure:
ALTER INDEX ALL ON dbo.Orders REBUILD
UPDATE STATISTICS dbo.Orders
Now let's try our original query out with our earlier modifications - what sort of improvement on execution time can we expect? We'll flush the procedure cache and buffer cache first, and turn the statistics back on:
SET STATISTICS IO ON
SET STATISTICS TIME ON
DBCC FREEPROCCACHE
DBCC DROPCLEANBUFFERS
CREATE TABLE #ConfigVariables ( StartDate DATE, EndDate DATE, SiteName VARCHAR(20) )
INSERT INTO #ConfigVariables VALUES('2012-03-01', '2012-03-31', 'Wolverhampton')
SELECT  o.CustomerID,
  SUM(o.OrderValueNoVAT + o.VATValue) [GrandTotal],
  ROUND(AVG((o.OrderValueNoVAT + o.VATValue)),2) [AverageOrderValueIncVAT],
  COUNT(*) [Num_Of_Orders]
FROM  dbo.Orders o, #ConfigVariables cv
WHERE  o.OrderCancelled = 0
AND  o.OrderTimeStamp BETWEEN cv.StartDate AND cv.EndDate
AND  o.SiteName = cv.SiteName
GROUP BY o.CustomerID
ORDER BY SUM(o.OrderValueNoVAT + o.VATValue) DESC
OPTION  (MAXDOP 1, OPTIMIZE FOR UNKNOWN)
Here's the results:
SQL Server parse and compile time: CPU time = 32 ms, elapsed time = 32 ms.
Table 'Orders'. Scan count 1, logical reads 8, physical reads 3, read-ahead reads 0, lob logical reads 0, lob physical reads 0, lob read-ahead reads 0.
Table '#ConfigVariables____________________________________________________00000000000B'. Scan count 1, logical reads 1, physical reads 0, read-ahead reads 0, lob logical reads 0, lob physical reads 0, lob read-ahead reads 0.
SQL Server Execution Times: CPU time = 0 ms, elapsed time = 56 ms.
As you can see, from a cold cache we've got an execution time of 56ms.
Let's run it from a warm cache:
SQL Server parse and compile time: CPU time = 0 ms, elapsed time = 0 ms.
Table 'Orders'. Scan count 1, logical reads 8, physical reads 0, read-ahead reads 0, lob logical reads 0, lob physical reads 0, lob read-ahead reads 0.
Table '#ConfigVariables_____________________________________________________00000000000B'. Scan count 1, logical reads 1, physical reads 0, read-ahead reads 0, lob logical reads 0, lob physical reads 0, lob read-ahead reads 0.
SQL Server Execution Times: CPU time = 0 ms, elapsed time = 45 ms
This represents a significant improvement in execution time - 45ms is extraordinarily quick. It's worth noting that if we ignore the system-wide gains to be had by reusing the same plan and revert to an earlier version of our query, we can make it run even faster, albeit at the expense of an ad-hoc plan for every execution:
 SELECT  o.CustomerID,
  SUM(o.OrderValueNoVAT + o.VATValue) [GrandTotal],
  ROUND(AVG((o.OrderValueNoVAT + o.VATValue)),2) [AverageOrderValueIncVAT],
  COUNT(*) [Num_Of_Orders]
 FROM  dbo.Orders o
 WHERE  o.OrderCancelled = 0
 AND  o.OrderTimeStamp BETWEEN '2012-03-01' AND '2012-03-31'
 AND  o.SiteName = 'Wolverhampton'
 GROUP BY o.CustomerID
 ORDER BY SUM(o.OrderValueNoVAT + o.VATValue) DESC
 OPTION  (MAXDOP 1, OPTIMIZE FOR UNKNOWN)
This returns from a cold cache in just 11ms, and from a warm cache in 1ms as shown below:
SQL Server parse and compile time: CPU time = 0 ms, elapsed time = 0 ms.
Table 'Orders'. Scan count 1, logical reads 8, physical reads 0, read-ahead reads 0, lob logical reads 0, lob physical reads 0, lob read-ahead reads 0.
SQL Server Execution Times: CPU time = 0 ms, elapsed time = 1 ms.
We have finally achieved an execution time of just 1ms for a SELECT query on a table with 5m rows!
There's a couple of notes to make here - firstly, partitioning is available only in Enterprise and Developer editions. Secondly that depending on the velocity of your data (how quickly new data enters the table in relation to the contents of the rest of the table and your partition function), the partitions you select may quickly become obsolete, with new data being added to the end partition (depending on whether you selected RANGE LEFT / RANGE RIGHT). The way to overcome this is by using dynamic repartitioning - essentially, redefining the partition automatically at intervals determined by the velocity of your data. This can be achieved using SQL Agent and some custom logic, together with some interval mathematics. I hope to write a tip soon covering this subject in some depth, so watch this space!
Summary of Results
Let's now summaries the improvements we've made to this query:
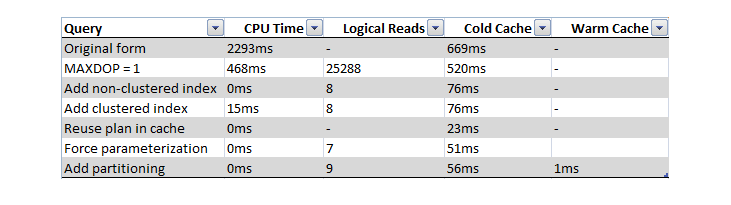
As you can see, we've made significant improvements on the original query, and we can apply this methodology, together with many other techniques detailed in other tips at MSSQLTips.com, to performance-tune our queries and database objects to the nth degree.
Next Steps
- SQL Server Index Design Guide - http://technet.microsoft.com/en-us/library/jj835095.aspx
- Simple Parameterization - http://technet.microsoft.com/en-us/library/ms186219(v=sql.105).aspx
- Forced Parameterization - http://technet.microsoft.com/en-us/library/ms175037(v=sql.105).aspx
- T-SQL Query Hints - http://technet.microsoft.com/en-us/library/ms181714.aspx
- CREATE PARTITION FUNCTION - http://technet.microsoft.com/en-us/library/ms187802.aspx
- CREATE PARTITION SCHEME - http://technet.microsoft.com/en-us/library/ms179854.aspx
- Understanding Partitioning - http://technet.microsoft.com/en-us/library/ms188232(v=sql.105).aspx
- Handling Large SQL Server Tables with Data Partitioning -
http://www.mssqltips.com/sqlservertip/1200/handling-large-sql-server-tables-with-data-partitioning/ - Identify Overloaded SQL Server Partitions -
http://www.mssqltips.com/sqlservertip/2021/identify-overloaded-sql-server-partitions/ - Buffer cache in SQL Server - http://technet.microsoft.com/en-us/library/aa337525(v=sql.105).aspx
- Execution Plan Caching and Reuse - http://technet.microsoft.com/en-us/library/ms181055(v=sql.105).aspx


About the author
 Derek Colley is a UK-based DBA and BI Developer with more than a decade of experience working with SQL Server, Oracle and MySQL.
This author pledges the content of this article is based on professional experience and not AI generated.
View all my tips
