By: Scott Murray | Comments (7) | Related: > Analysis Services Development
Problem
I have used the Top and Bottom
T-SQL functions in SQL Server; do the same functions exist in the
SQL Server Analysis Services (SSAS) or
MDX? If so, how do they work?
Can you provide some examples? Check out this tip to learn more.
Solution
Within SQL Server Analysis Services (SSAS), several top and bottom functions exists and can be used in various scenarios to ascertain a ranking of measures and even dimensions. These functions do have some similarities to the SQL Top and Bottom expressions, but also differ in mode and use from their SQL cousin. The six functions SSAS are:
- TopCount
- TopPercent
- TopSum
- BottomCount
- BottomPercent
- BottomSum
The TopPercent and BottomPercent functions are essentially ordered lists which show any value whose cumulative total falls within the specified percentage value supplied within the function. For example, using TopPercent, and a value of 20 would first order all the values in the set from highest to lowest and then would calculate which values originate within the top 20%, cumulatively, of the total of all numbers. A value will qualify as long as the somewhere between the previous figure and the current figure fall within the percentage range. The TopCount and BottomCount work similarly except instead of using the percentage of the total, these functions use a whole number value to determine the number of values to display; again, the set is ordered using either the highest values for the TopCount or the lowest values for the bottom count. Last, the TopSum and BottomSum again order the measure noted in the set specified, and include all measure values whose cumulative total fall within the value specified. The ordering is again in descending order with the highest values used for the TopSum, whereas the lowest values are used for the BottomSum and are sorted is ascending order. Several specific examples will be reviewed later in this tip.
SQL Server Analysis Services TopPercent and BottomPercent Functions
Both the TopPercent and BottomPercent functions require three arguments:
- A set expression which is basically an expression which returns a set of values, such as a dimension or hierarchy
- A percentage which describes the threshold of values to be returned. Note this value cannot be negative and is actually a raw percentage times 100. For example 22% would be listed as 22 and not 0.22
- A numeric expression is the measure or calculation which will be used to order the set expression and be evaluated against the above percentage.
Another significant caveat with the use of TopPercent pertains to negative values being returned for the sets. If negative values are returned by the measure, only one row is returned. This same restriction does not impact BottomPercent. The basic syntax of the expression are displayed below.
TopPercent(Set_Expression, Percentage, Numeric_Expression)

or

BottomPercent(Set_Expression, Percentage, Numeric_Expression)
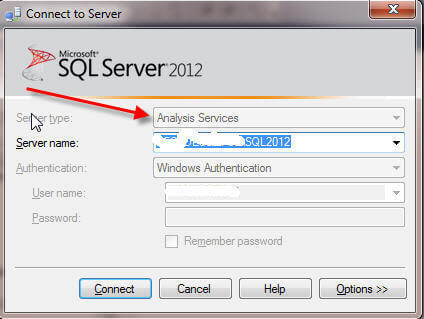
To allow you to follow along, we will use the AdventureWorks 2012 Data Warehouse MultiDimensional sample database which is available on CodePlex at: http://msftdbprodsamples.codeplex.com/releases/view/55330. Once you have the SQL Server and OLAP databases installed processed, you can open SQL Server Management Studio (SSMS) 2012 and connect to the server where you installed the OLAP database. Be sure to change the connection server type to "Analysis Services" as shown in the image below. Finally, if not already open, open a New MDX query.
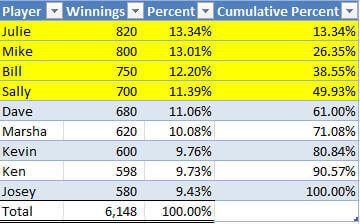
To better explain how the "percentage" value works, a basic example is included in the next illustration. The set of players in this example is a group of poker players whose names are listed in the first column. If we would like to use the TopPercent function and use 40% as our percent value, the TopPercent function will return the 4 rows which are highlighted in yellow. Of course the fourth row, exceeds the 40% threshold; however since part of the value falls within the 40% threshold, that row is included. The BottomPercent would work in the opposite direction, first sorting the list lowest to highest, and then including whichever rows were contained or included within the percentage, 40% in our example.
Turning to an Adventure Works MDX example which is noted below, we will use the Internet Sales Amount as the Measure value, use 55 as the percent, and use the Product Model Lines > Model hierarchy as the dimensions set. Furthermore, to make the example even clearer, I took the liberty to add a few items to the MDX query. The WITH MEMBER lines create three named calculated members to the query; one member is for the current member Internet Sales Amount. The second calculated member is the Total Internet Sales Amounts, and the third is dividing the current member Internet Sales Amount by the Total Internet Sales Amount for all Product Models. This percentage makes it easier to see how our results match up with the percentage selected. Next we place these three calculated members on the column axis, and last, and most important to this tip, the TopPercent function, as described above, is listed on the row axis. For this example, the results will display all the Product Line Models that consist of 55% of the Internet Sales.
WITH
MEMBER [Measures].[Internet Sales] AS [Measures].[Internet Sales Amount]
MEMBER [Measures].[Total Internet Sales] AS ([Measures].[Internet Sales Amount],
 [Product].[Product Model Lines].[All Products])
MEMBER [Measures].[Percent of Total] AS [Measures].[Internet Sales] /
 [Measures].[Total Internet Sales], FORMAT_STRING='Percent'
SELECT
{
[Measures].[Internet Sales] AS Internet_Sales
,[Measures].[Total Internet Sales] AS [Total Internet Sales]
,[Measures].[Percent of Total]
}
ON COLUMNS,
TopPercent
   ({[Product].[Product Model Lines].[Model].Members}  --Dimension
   , 55 --Percent
   , [Measures].[Internet Sales Amount] --Measure
   ) ON ROWS
FROM [Adventure Works]
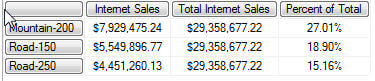
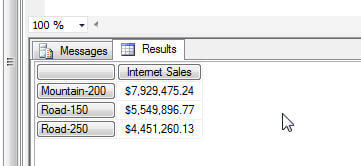
The results of this query are displayed in the next illustration. You will notice that the first 2 rows clearly fall under the 55% as they added in a running total, while row three meets, but ultimately exceeds the 55% threshold. The inclusion is based on a scale similar to a number line, so rows (or product models in this example) which partially lie within the threshold are included.
Using the opposite approach, the below MDX query retrieves the Bottom 10% of values. A few additional items have been added to this query to account for Models with no Internet Sales Amount or NULL values. First, in the calculated measures, an IIF expression is used to test for an Internet Sales Amount = 0. By default, a NULL value is converted to 0 which allows us to use this check. Secondly, the NON EMPTY function is used around the BottomPercent statement to remove the blank or NULL values from the list. Otherwise, a large number of null values may be included.
WITH
MEMBER [Measures].[Internet Sales] AS [Measures].[Internet Sales Amount]
MEMBER [Measures].[Total Internet Sales] AS
 IIf([Measures].[Internet Sales Amount] = 0,
 NULL,([Measures].[Internet Sales Amount],
 [Product].[Product Model Lines].[All Products]))
MEMBER [Measures].[Percent of Total] AS
 IIf([Measures].[Internet Sales Amount] = 0,
 NULL,[Measures].[Internet Sales] /
  [Measures].[Total Internet Sales]), FORMAT_STRING='Percent'
SELECT
{
[Measures].[Internet Sales] AS Internet_Sales
,[Measures].[Total Internet Sales] AS [Total Internet Sales]
,[Measures].[Percent of Total]
}
ON COLUMNS,
NON EMPTY(
BottomPercent
   ({[Product].[Product Model Lines].[Model].Members}  --Dimension
   , 10 --Percent
   , [Measures].[Internet Sales Amount] --Measure
   )
   ) ON ROWS
FROM [Adventure Works]
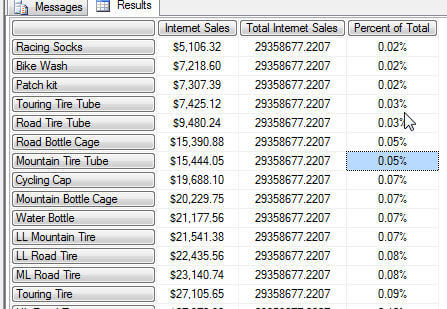
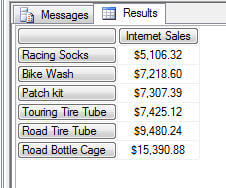
A partial set of results for this query is displayed in the following screen print. For this example, the list is much longer, since the cumulative percentage of Models consisting of the bottom 10% of Internet Sales is a much larger figure.
The TopPercent and BottomPercent functions provide a quick way to determine, for instance, the Top 20% of your sales is made up of what product models, or, to the contrary, which products lag in the bottom 10% of your sales.
SQL Server Analysis Services TopSum and BottomSum Functions
The TopSum and BottomSum work very similar to the TopPercent and BottomPercent functions, but instead of using a percentage, the cumulative / running totals are compared against a numeric value. The TopSum function again orders the measure values from highest to lowest and then includes all values whose cumulative total adds up to and includes the number supplied as the threshold. The BottomSum works in ascending order, but again accumulates the cumulative running total except it moves from the lowest value to the highest value. The syntax for these two functions is noted below.
TopSum(Set_Expression, Value, Numeric_Expression)

or

BottomSum(Set_Expression, Value, Numeric_Expression)
The following example uses the same Internet Sales Amount measure and Product Model Lines dimension; however we are looking for the Top product lines who cumulatively make up 7.5 million dollars in Internet Sales.
WITH
MEMBER [Measures].[Internet Sales] AS [Measures].[Internet Sales Amount]
SELECT
{
[Measures].[Internet Sales] AS Internet_Sales
}
ON COLUMNS,
TopSUM
   ({[Product].[Product Model Lines].[Model].Members}  --Dimension
   , 15000000 --cumulative sum
   , [Measures].[Internet Sales Amount] --Measure
   )  ON ROWS
FROM [Adventure Works]
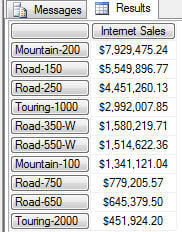
From the results, the three models consist of the first $15,000,000 in Internet Sales.
The BottomSum requires the same check as the BottomPercent for the empty or NULL values. However, as compared to the BottomPercent function, we are not including the "roll up" total sales or percent of total calculated members, nor the IIF statements. Only the NON EMPTY function is used.
WITH
MEMBER [Measures].[Internet Sales] AS [Measures].[Internet Sales Amount]
SELECT
{
[Measures].[Internet Sales] AS Internet_Sales
}
ON COLUMNS,
NON EMPTY (
BottomSUM
   ({[Product].[Product Model Lines].[Model].Members}  --Dimension
   , 50000 --cumulative sum
   , [Measures].[Internet Sales Amount] --Measure
   )
   )ON ROWS
FROM [Adventure Works]
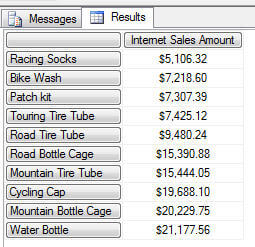
The results show the bottom list of Product Models which make up the last $50,000 in Internet Sales and are displayed below.
Again, this functionality is handy for determining your top and bottom performers. However, care must be taken that you are using the correct set expressions. In these examples we are always evaluating against the Product Model Lines hierarchy sets, but you could just as easily evaluate the measure over a date or location hierarchy, for instance.
SQL Server Analysis Services TopCount and BottomCount Functions
Using the TopCount and BottomCount functions is probably the easiest of the methodologies to understand. The same ordering takes place as with the TopSum and TopPercent (descending order) as well as the BottomSum and BottomCount (ascending order). However, as displayed in the below view of the functions syntax, a count value is used to determine the actual number of rows to return. This function is, of course, quite similar to the TOP n function used in regular SQL statements.
TopCount(Set_Expression, Count, Numeric_Expression)

or

BottomCount(Set_Expression, Count, Numeric_Expression)
The query illustrated in the next set of code, asks for the TOP 10 Product Model Lines based on the Internet Sales Amount
WITH
MEMBER [Measures].[Internet Sales] AS [Measures].[Internet Sales Amount]
SELECT
{
[Measures].[Internet Sales] AS Internet_Sales
}
ON COLUMNS,
TopCount
   ({[Product].[Product Model Lines].[Model].Members}  --Dimension
   , 10 --count
   , [Measures].[Internet Sales Amount] --Measure
   )  ON ROWS
FROM [Adventure Works]
These results show us the Top 10 Product Model Lines.
We run into the same issue again with the NULL values on the BottomCount example; thus we use the NONEMPTY function again, to exclude those products who have no sales.
SELECT
{
[Measures].[Internet Sales Amount] AS Internet_Sales
}
ON COLUMNS,
(
BottomCount
   (NONEMPTY([Product].[Product Model Lines].[Model].Members,{[Measures].[Internet Sales Amount]})
     --Dimension
   , 10--count
   , [Measures].[Internet Sales Amount] --Measure
   )
   )ON ROWS
FROM [Adventure Works]
The BottomCount results are displayed below; the lowest 10 product lines, by Internet Sales, are listed below
Again, the TopCount and BottomCount functions provide a way to get the pure top and bottom players for a selected hierarchy.
Conclusion
Using the Top and Bottom functions provides cube query designers the ability to quickly and easily obtain the top or bottom instances of values for a particular dimension. For each of the functions, a set of top or bottom figures is returned, either based on a cumulative percentage of the total amount, a fixed cumulative roll up of the total, or a fixed count of rows. As with many functions and expressions in MDX, care must be taken to properly assign an appropriate set to evaluate against.
Next Steps
- Consider these functions as you need to perform your next set of calculations in SQL Server Analysis Services
- Check out these resources:


About the author
 Scott Murray has a passion for crafting BI Solutions with SharePoint, SSAS, OLAP and SSRS.
This author pledges the content of this article is based on professional experience and not AI generated.
View all my tips
