By: Ben Snaidero | Comments | Related: > Profiler and Trace
Problem
Have you ever had the need to reproduce a specific issue from production in another environment for debugging or wanted the ability to test the exact same data load on a different server configuration or hardware? Available since SQL Server 2005 is the trace replay functionality within SQL Profiler which allows us to do exactly what is described above. This tip will walk through a simple example to demonstrate how this feature can be used.
Solution
Table Setup to capture SQL Server Profiler Data
Before we can get started with running a trace we'll need a table and script that we can use to run the trace against. The first script below creates a simple table with a few different column datatypes. The second script we will run while the trace is running so we can capture INSERT, UPDATE, DELETE and SELECT activity to be replayed.
CREATE TABLE [dbo].[TABLE1](
 [pkcol] [int] NOT NULL,
 [datacol1] [int] NULL,
 [datacol2] [int] NULL,
 [datacol3] [varchar](50) NULL,
 [datacol4] [datetime] NULL,
 CONSTRAINT [PK_TABLE1] PRIMARY KEY CLUSTERED ( [pkcol] ASC )
  WITH (PAD_INDEX = OFF, STATISTICS_NORECOMPUTE = OFF, IGNORE_DUP_KEY = OFF,
        ALLOW_ROW_LOCKS = ON, ALLOW_PAGE_LOCKS = ON) ON [PRIMARY]
) ON [PRIMARY]
SELECT GETDATE(),'Start insert' GO -- INSERT DATA INSERT INTO dbo.Table1(pkcol, datacol1, datacol2, datacol3, datacol4) VALUES (1,1,1,'TEST',getdate()-1) GO WAITFOR DELAY '00:00:01' GO INSERT INTO dbo.Table1(pkcol, datacol1, datacol2, datacol3, datacol4) VALUES (2,2,2,'TEST',getdate()-2) GO WAITFOR DELAY '00:00:01' GO INSERT INTO dbo.Table1(pkcol, datacol1, datacol2, datacol3, datacol4) VALUES (3,3,3,'TEST',getdate()-3) GO WAITFOR DELAY '00:00:01' GO INSERT INTO dbo.Table1(pkcol, datacol1, datacol2, datacol3, datacol4) VALUES (4,4,4,'TEST',getdate()-4) GO WAITFOR DELAY '00:00:01' GO INSERT INTO dbo.Table1(pkcol, datacol1, datacol2, datacol3, datacol4) VALUES (5,5,5,'TEST',getdate()-5) GO WAITFOR DELAY '00:00:01' GO SELECT GETDATE(),'End insert' GO SELECT GETDATE(),'Start update' GO -- UPDATE DATA DECLARE @updval INT SELECT TOP 1 @updval=pkcol FROM dbo.TABLE1 ORDER BY NEWID() UPDATE dbo.TABLE1 SET datacol1=1+50000, datacol2=1+50000, datacol3='TESTUPD', datacol4=getdate()+365 WHERE pkcol=@updval GO WAITFOR DELAY '00:00:01' GO DECLARE @updval INT SELECT TOP 1 @updval=pkcol FROM dbo.TABLE1 ORDER BY NEWID() UPDATE dbo.TABLE1 SET datacol1=2+50000, datacol2=2+50000, datacol3='TESTUPD', datacol4=getdate()+365 WHERE pkcol=@updval GO WAITFOR DELAY '00:00:01' GO DECLARE @updval INT SELECT TOP 1 @updval=pkcol FROM dbo.TABLE1 ORDER BY NEWID() UPDATE dbo.TABLE1 SET datacol1=3+50000, datacol2=3+50000, datacol3='TESTUPD', datacol4=getdate()+365 WHERE pkcol=@updval GO WAITFOR DELAY '00:00:01' GO DECLARE @updval INT SELECT TOP 1 @updval=pkcol FROM dbo.TABLE1 ORDER BY NEWID() UPDATE dbo.TABLE1 SET datacol1=4+50000, datacol2=4+50000, datacol3='TESTUPD', datacol4=getdate()+365 WHERE pkcol=@updval GO WAITFOR DELAY '00:00:01' GO DECLARE @updval INT SELECT TOP 1 @updval=pkcol FROM dbo.TABLE1 ORDER BY NEWID() UPDATE dbo.TABLE1 SET datacol1=5+50000, datacol2=5+50000, datacol3='TESTUPD', datacol4=getdate()+365 WHERE pkcol=@updval GO WAITFOR DELAY '00:00:01' GO SELECT GETDATE(),'End update' GO SELECT GETDATE(),'Start delete' GO -- DELETE DATA DECLARE @delval INT SELECT TOP 1 @delval=pkcol FROM dbo.TABLE1 ORDER BY NEWID() DELETE FROM dbo.TABLE1 WHERE pkcol=@delval GO WAITFOR DELAY '00:00:01' GO DECLARE @delval INT SELECT TOP 1 @delval=pkcol FROM dbo.TABLE1 ORDER BY NEWID() DELETE FROM dbo.TABLE1 WHERE pkcol=@delval GO WAITFOR DELAY '00:00:01' GO DECLARE @delval INT SELECT TOP 1 @delval=pkcol FROM dbo.TABLE1 ORDER BY NEWID() DELETE FROM dbo.TABLE1 WHERE pkcol=@delval GO WAITFOR DELAY '00:00:01' GO DECLARE @delval INT SELECT TOP 1 @delval=pkcol FROM dbo.TABLE1 ORDER BY NEWID() DELETE FROM dbo.TABLE1 WHERE pkcol=@delval GO WAITFOR DELAY '00:00:01' GO DECLARE @delval INT SELECT TOP 1 @delval=pkcol FROM dbo.TABLE1 ORDER BY NEWID() DELETE FROM dbo.TABLE1 WHERE pkcol=@delval GO WAITFOR DELAY '00:00:01' GO SELECT GETDATE(),'End delete' GO SELECT GETDATE(),'Start select' GO -- SELECT DATA SELECT TOP 1 * FROM dbo.TABLE1 ORDER BY NEWID() GO WAITFOR DELAY '00:00:01' GO SELECT TOP 1 * FROM dbo.TABLE1 ORDER BY NEWID() GO WAITFOR DELAY '00:00:01' GO SELECT TOP 1 * FROM dbo.TABLE1 ORDER BY NEWID() GO WAITFOR DELAY '00:00:01' GO SELECT TOP 1 * FROM dbo.TABLE1 ORDER BY NEWID() GO WAITFOR DELAY '00:00:01' GO SELECT TOP 1 * FROM dbo.TABLE1 ORDER BY NEWID() GO WAITFOR DELAY '00:00:01' GO SELECT GETDATE(),'End select' GO
Running the SQL Server Trace
I'm sure most of us are familiar with running a SQL trace using Profiler, but for those of us that aren't this tip outlines the basics.
There are however, a few things specific to setting up a trace that need to be done if the trace file is going to be used for replay at a later time. This link outlines these requirements which mainly entail having specific event classes and data columns selected in your trace configuration. Luckily SQL Profiler comes with a trace template that includes these settings called "TSQL_Replay". I usually use this template as the base for my profiler settings and add any other events/columns I think are necessary.
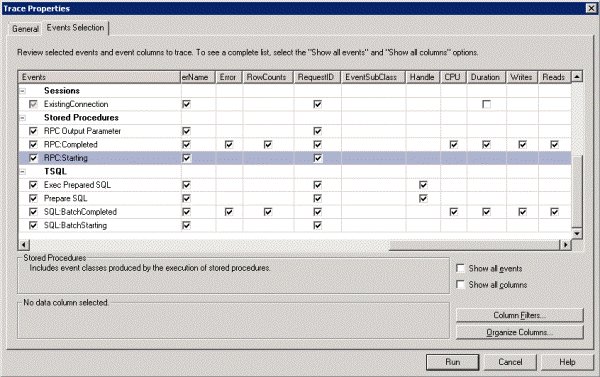
For this example, after starting up SQL Profiler you can configure the trace as shown in the two screenshots below. In the first screenshot you can see that I've updated the "Trace Name" and selected the "TSQL_Replay" template. I've also configured the trace to be saved to a file (although this could be done after you stop the trace). In the second screenshot you can see that I've added the CPU, Duration, Reads and Writes columns to the "RPC:Completed" and "SQL:BatchCompleted" events.
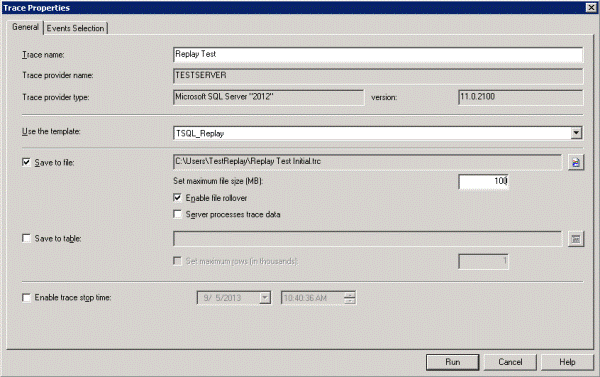
Now that we've configured the trace we can click the "Run" button to start it. Once running open up the test script from the table setup section in a new query window in SQL Server Management Studio and run it. After it's completed go back to SQL Profiler and stop the trace. You should now have a completed trace file in the location you specified when setting up the trace (if you did not configure this save the trace from the current window to somewhere on your filesystem) so we can close this window.
Replaying the SQL Server Trace
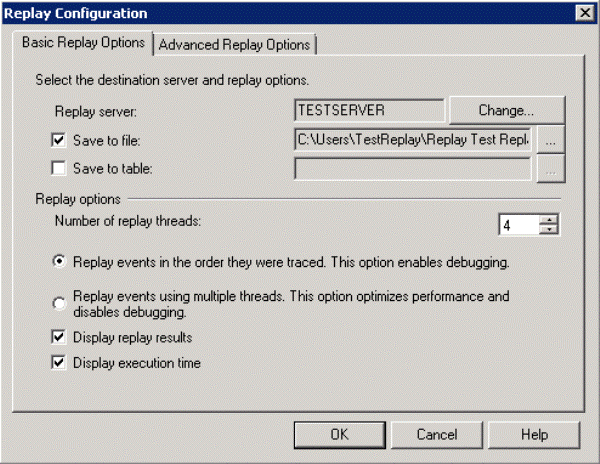
In order to replay the trace file we need to re-open it in SQL Profiler. Once the file has been read in you can see that the menu items under the "Replay" menu are now enabled (you'll notice if you looked at this menu item before closing the trace file they were all greyed out). Select "Start" under this menu and a window will pop up where we can configure the replay options. The first tab in this window is the Basic options. A complete description of all the options on this tab can be found here but for this tip we'll just configure a few of the options. We're going to first check the "Save to file:" and "Display execution time" checkboxes. Finally and probably the most useful option on this tab is the "Replay Server:" option. Although we are not going to do it for this tip, this is the option that would allow you to run this replay against a different server if required. Here is a screenshot of this tab after it's been completed.
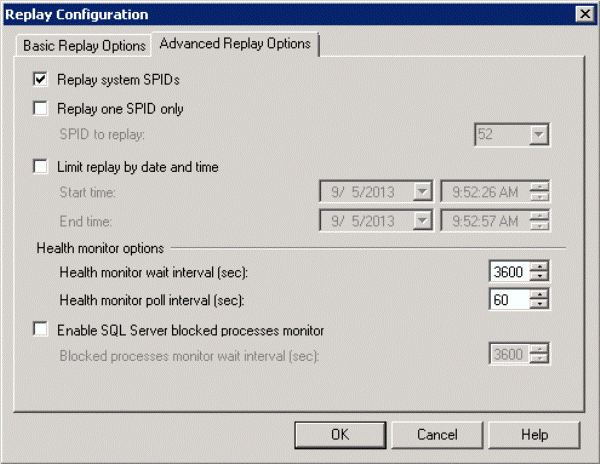
The second tab in this window contains the advanced options. A complete description of all the options on this tab can be found here. For this tip we'll just leave all the defaults selected on this tab. Here is a screenshot of what's available on this tab.
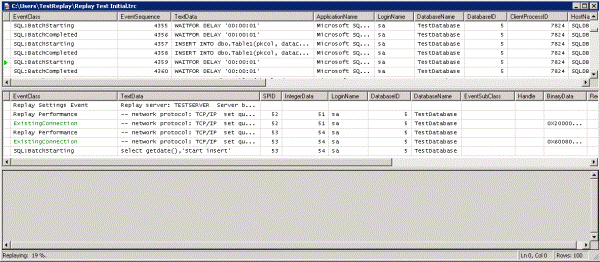
Now that we have configured all the required options we can click "OK" to start the replay. Once we click this button we see a second section open below the original trace which shows the results of our replay. You'll also notice a green arrow traversing through your original trace which highlights the statement that is currently being executed.
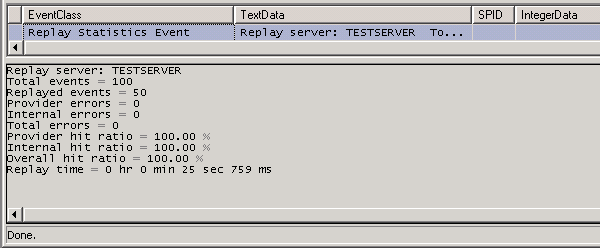
Once the replay is complete you can go through the replay trace file and check for any errors and validate execution times. The replay trace also contains a "Replay Statistics Event" which provides a good summary or your replay session. Here is what the details of that trace event look like.
Next Steps
- For recreating more complex workloads have a look at the SQL Server Distributed Replay utility (look for a future tip on this topic)
- Investigate other tools that can be used to recreate SQL workloads
- More tips on SQL Profiler


About the author
 Ben Snaidero has been a SQL Server and Oracle DBA for over 10 years and focuses on performance tuning.
This author pledges the content of this article is based on professional experience and not AI generated.
View all my tips
