By: Brady Upton | Comments (4) | Related: > Monitoring
Problem
I would like to monitor some performance metrics and I don't have the budget to purchase a third party monitoring product. Is there a way to capture performance metrics and view the trends of data in a graphical format using SQL Server Reporting Services?
Solution
Third party tools are awesome for capturing performance metrics, but some small shops (and even large shops) don't budget for this type of software leaving it up to the DBA to create their own monitoring solution.
There are a few different ways to capture certain performance metrics, but in this tip we'll focus on using the sys.dm_os_performance_counters DMV and how to view this data in a more readable form using SQL Server Reporting Services graphs. Tim Ford explains this DMV in this tip, but basically it's similar to Windows Performance Monitor, or PerfMon, in that it captures live performance data. The DMV doesn't include all the counters as Performance Monitor, but it does show the SQL Server related counters. (Note that some of the counters in this DMV are of cumulative values since the last reboot.)
You can query this DMV using the following query:
SELECT * FROM sys.dm_os_performance_counters
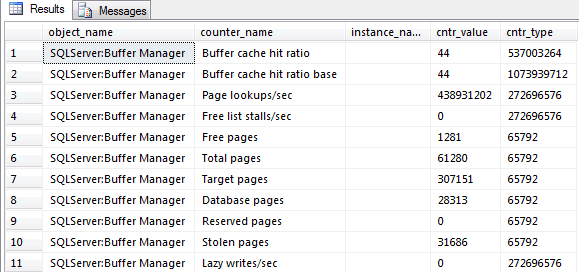
As you can see from the screenshot above, this can be hard to read. Also, it only shows the current values at the time the query is executed so you don't know anything about the past and it makes it hard to see how the data fluctuates during the business day.
Collecting the SQL Server Monitoring Report Data
For the purpose of simplicity, this tip will focus on one counter, Page Life Expectancy (PLE). I'll show you how to capture data and create a graph for analysis.
First, we'll need to create a table that will store our metrics:
[ID] [int] IDENTITY(1,1) NOT NULL,
[object_name] [varchar](128) NOT NULL,
[counter_name] [varchar](128) NOT NULL,
[cntr_value] [bigint] NOT NULL,
[collection_datetime] [datetime] NOT NULL )
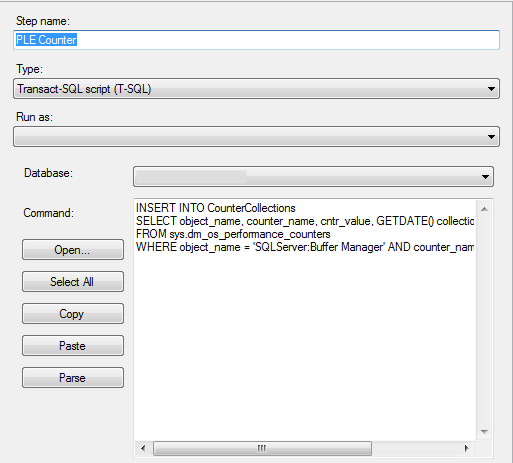
Next, we'll need to create a script that will insert our data into the table we created above:
SELECT object_name, counter_name, cntr_value, GETDATE() collection_datetime
FROM sys.dm_os_performance_counters
WHERE object_name = 'SQLServer:Buffer Manager'
AND counter_name = 'Page life expectancy'
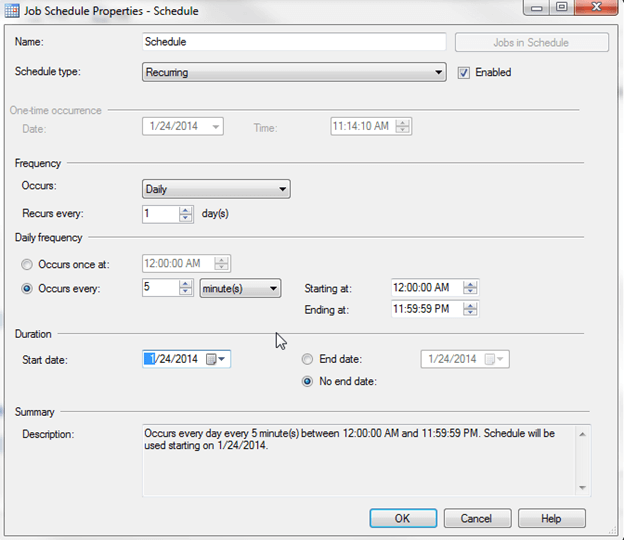
Finally, we'll need to create a SQL Server Agent Job that will run the script above on a specified schedule:
I'll run this job every 5 minutes:
Creating the SQL Server Monitoring Report
While the table gathers data we can switch over to Business Intelligence Development Studio (BIDS) or the SQL Server Data Tools (SSDT) and create a SSRS Report that will display our data.
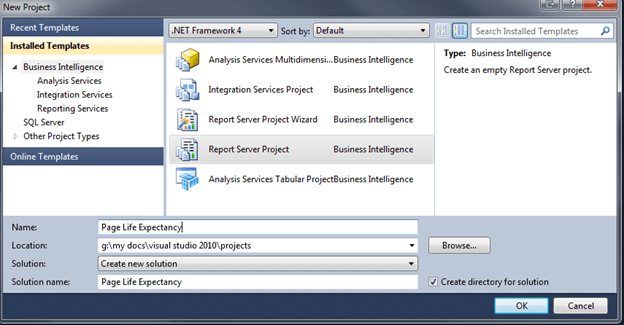
In this example, I'm using SSDT. Choose File, New Project. On the New Project dialog choose Report Server Project and name the Project:
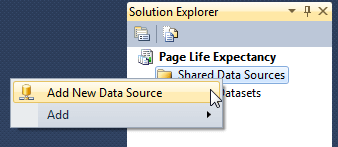
Right click Shared Data Sources and Add New Data Source:
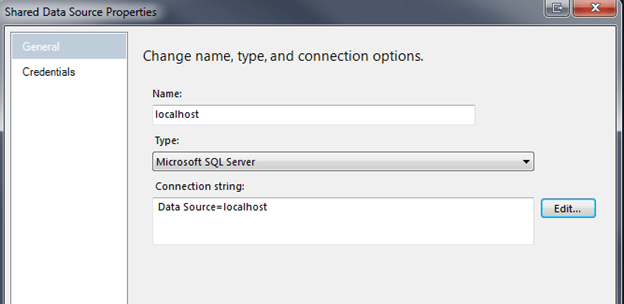
For this example, I'll use localhost:
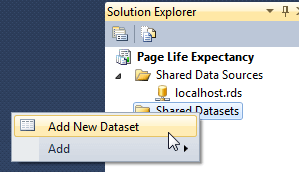
Next right click Shared Dataset and Add New Dataset:
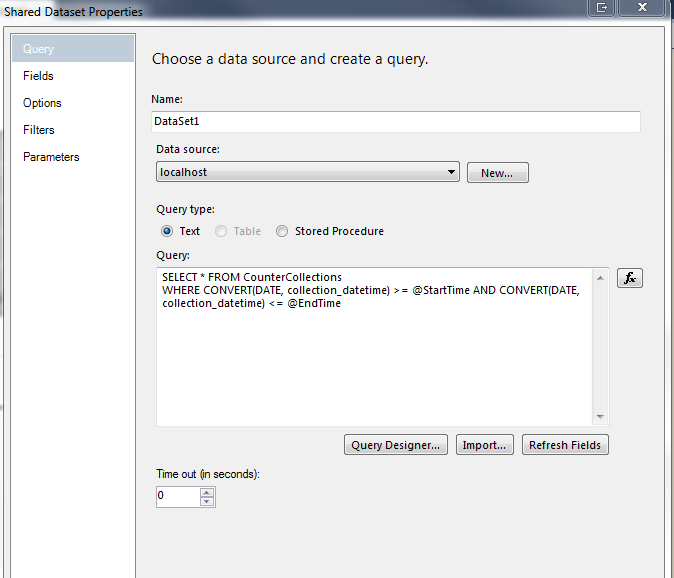
This is where you will build the query that you want to use in the report. I will use the following query where the WHERE clause creates the Start and End time parameters:
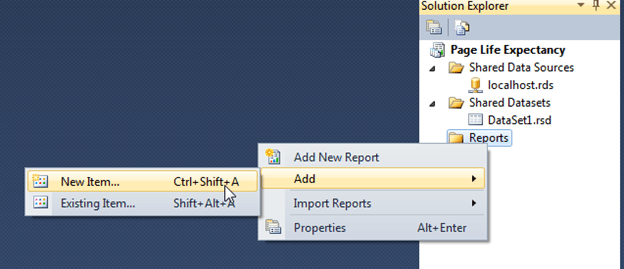
Next click Reports, Add, New Item:
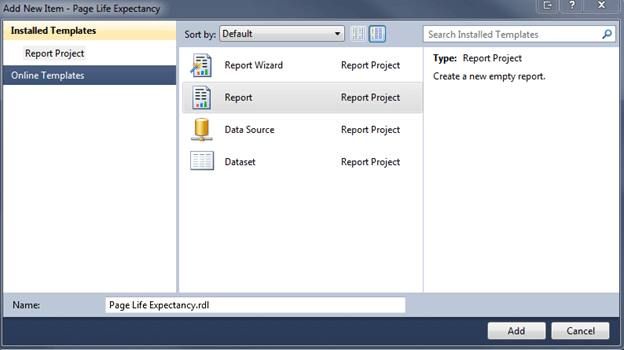
Click Report and specify a name:
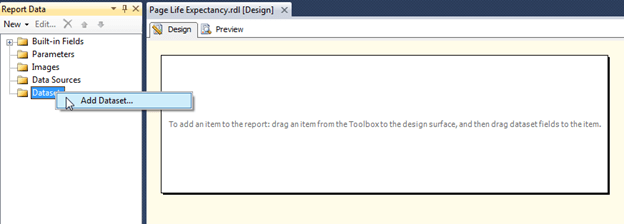
A fresh, clean report should appear. In the Report Data tab, right click Datasets and Add Dataset:
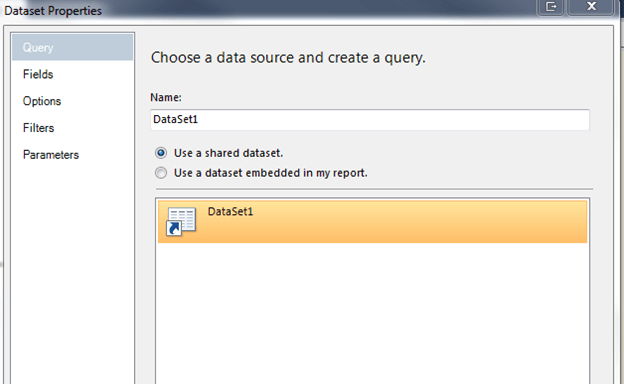
Click on the Dataset that we created earlier and click OK:
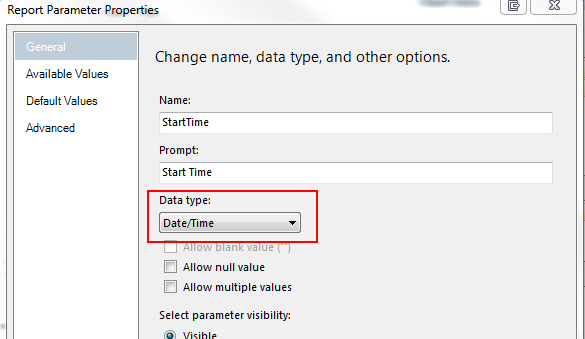
Expand Parameters and double click each parameter and set the Data type as Date/Time:
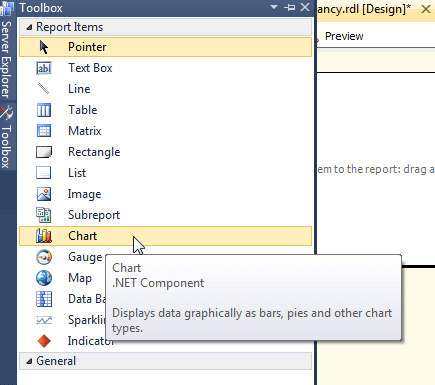
From the Toolbox, click on Chart and drag it into the Design View:
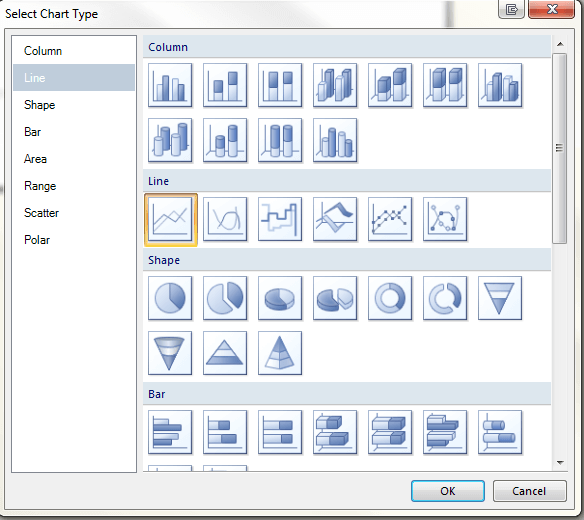
Choose a Line Graph:
Click on the Chart and you should see a Chart Data box appear. Add cntr_value to Values and collection_datetime to Category groups:
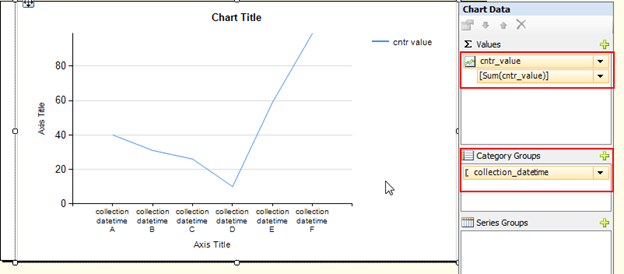
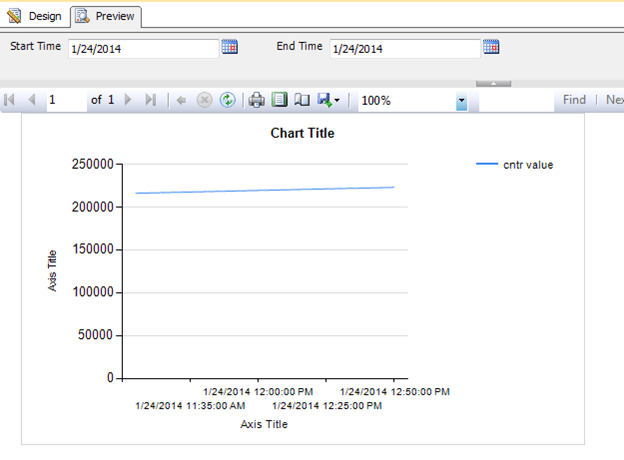
We can now click on Preview to see the trends that relate to Page Life Expectancy:
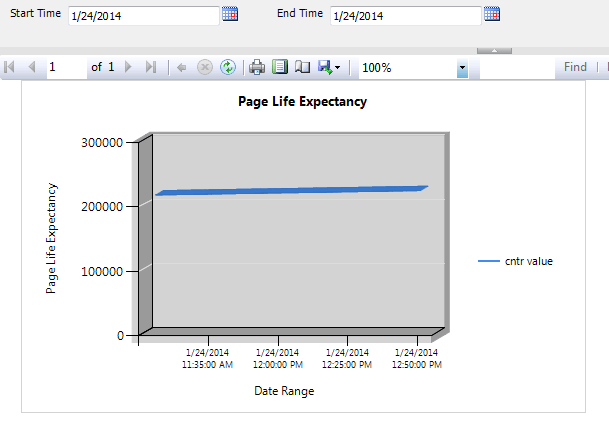
Once you have the data showing correctly, you can format the chart to look more user friendly:
This was just an example using the Page Life Expectancy counter. You can create this type of report using any counter that SQL Server offers. This type of report works great as a monitoring solution or to troubleshoot certain bottlenecks within SQL Server.
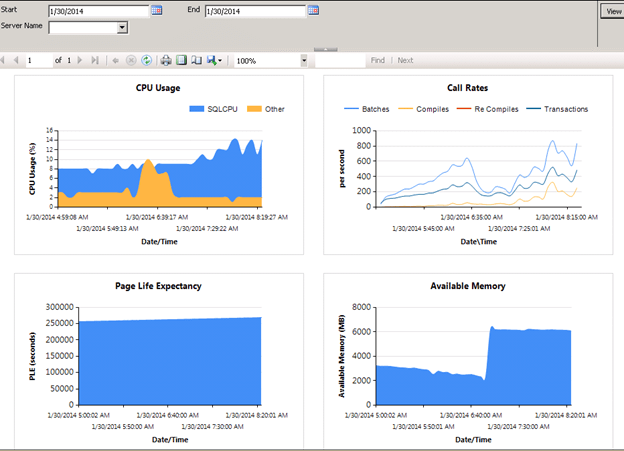
Another SSRS Monitoring Report Example with Multiple Counters
Here is another report example that you can create that has multiple counters and graphs.
Next Steps
- View all of the counters and a description of each from Microsoft here.
- Click here to download all of the components for this tip
- You can experiment with different chart types to determine what works best for you.


About the author
 Brady Upton is a Database Administrator and SharePoint superstar in Nashville, TN.
This author pledges the content of this article is based on professional experience and not AI generated.
View all my tips
