By: Daniel Farina | Comments (2) | Related: > Dynamic Management Views and Functions
Problem
You have a SQL Server query that always takes too long to execute. You have the execution plan so you know what the query does. But what is the query doing right now? Keep reading and you will know how to monitor query progress in real time.
Solution
How many times have you been asked the same question: how much longer until the process is complete? A few days ago at my work an analyst came to my desk to ask me that question about a step of a process. After a few queries I saw the step in question was a stored procedure performing an update, but that was the only thing I was able to say. Instantly a thought came to my mind: it would be good if this process was running on a SQL Server 2014 instance instead of this old and deprecated SQL Server 2000 version.
The fact is that in SQL Server 2014 we have a new Dynamic Management View to track what a query is actually doing at a physical operator level. I am referring to the sys.dm_exec_query_profiles Dynamic Management View (DMV).
The sys.dm_exec_query_profiles DMV
In order for this DMV to work we need to enable the capture of the query's Actual Execution Plan. So as you may guess, it doesn't work for plans stored in the Plan Cache. At this point maybe you are asking yourself why can't we get a real time status of any query running on an instance, and the answer is simple: nothing is free. I mean capturing these metrics has a performance cost due to the fact that SQL Server is collecting fine grained statistics of the query being analyzed.
A plan stored in the Plan Cache doesn't contain execution statistics. It contains estimations that are used to build the plan per se. When we talk about execution statistics we are talking about actual number of reads, writes, CPU time and so on.
Different Ways to Capture Real Time SQL Server Performance Data
We have three methods to capture the actual SQL Server Execution Plan:
- Setting either SET STATISTICS PROFILE or SET STATISTICS XML to ON into the Query being analyzed.
- Create a server side trace including one of these two events: "Showplan Statistics Profile" or "Showplan Statistics XML". Also if you feel more comfortable you can use SQL Server Profiler.
- Create an Extended Events Session and add sqlserver.query_post_execution_showplan as a target event.
The last two methods are useful when you cannot add a set statement to the query you want to analyze, but those methods should be used with caution because they affect server performance in a detrimental way.
Sample SQL Server Server Side Trace Script
Below is a sample trace creation script with the event "Showplan XML Statistics Profile" filtered by database name.
USE master
GO
-- Create a Queue
DECLARE @rc INT
DECLARE @TraceID INT
DECLARE @maxfilesize BIGINT
SET @maxfilesize = 5

-- Please replace the text InsertFileNameHere, with an appropriate
-- filename prefixed by a path, e.g., c:\MyFolder\MyTrace. The .trc extension
-- will be appended to the filename automatically. If you are writing from
-- remote server to local drive, please use UNC path and make sure server has
-- write access to your network share

EXEC @rc = sp_trace_create @TraceID OUTPUT, 0, N'InsertFileNameHere',
    @maxfilesize, NULL
IF ( @rc != 0 )
    GOTO error

-- Client side File and Table cannot be scripted

-- Set the events
DECLARE @on BIT
SET @on = 1
EXEC sp_trace_setevent @TraceID, 146, 12, @on
EXEC sp_trace_setevent @TraceID, 146, 35, @on


-- Set the Filters
DECLARE @intfilter INT
DECLARE @bigintfilter BIGINT

EXEC sp_trace_setfilter @TraceID, 35, 0, 6, N'AdventureWorks2012'
-- Set the trace status to start
EXEC sp_trace_setstatus @TraceID, 1

-- display trace id for future references
SELECT  TraceID = @TraceID
GOTO finish

error:
SELECT  ErrorCode = @rc

finish:

-- Stops Capturing Events
EXEC sp_trace_setstatus @TraceID, 0

GO

-- Delete trace definition from Server
EXEC sp_trace_setstatus @TraceID, 2

GO
GO
Sample SQL Server Extended Events Session Script
The next script will create an Extended Events Session with event "sqlserver.query_post_execution_showplan" filtered by database name and using the Ring Buffer as a target.
USE master
GO

--Create Extended Events Session
CREATE EVENT SESSION [Capture_Query_Plan] ON SERVER
ADD EVENT sqlserver.query_post_execution_showplan(
    WHERE ([database_name]=N'AdventureWorks2012'))
ADD TARGET package0.ring_buffer
WITH ( MAX_MEMORY = 4096 KB ,
        EVENT_RETENTION_MODE = ALLOW_SINGLE_EVENT_LOSS ,
        MAX_DISPATCH_LATENCY = 30 SECONDS ,
        MAX_EVENT_SIZE = 0 KB ,
        MEMORY_PARTITION_MODE = NONE ,
        TRACK_CAUSALITY = OFF ,
        STARTUP_STATE = OFF )
GO

--Start Extended Events Session
ALTER EVENT SESSION [Capture_Query_Plan] ON SERVER STATE = START
GO

--Stop Extended Events Session
ALTER EVENT SESSION [Capture_Query_Plan] ON SERVER STATE = STOP
GO

--Drop Extended Events Session
DROP  EVENT SESSION [Capture_Query_Plan] ON SERVER
GO
Samples
For the purposes of this tip I am using the AdventureWorks2012 database which you can download for free from CodePlex at this link http://msftdbprodsamples.codeplex.com/releases/view/55330.
Suppose we have the following query and let's see what we can do.
USE AdventureWorks2012
GO

SET STATISTICS XML ON

SELECT  *
FROM    Sales.SalesOrderHeader OH
    INNER JOIN Sales.SalesOrderDetail OD
  ON OD.SalesOrderID = OH.SalesOrderID
    INNER JOIN Sales.Customer C
  ON C.CustomerID = OH.CustomerID
    INNER JOIN Production.Product P
  ON P.ProductID = OD.ProductID
    INNER JOIN Production.ProductSubcategory PS
  ON pS.ProductSubcategoryID = P.ProductSubcategoryID

GO
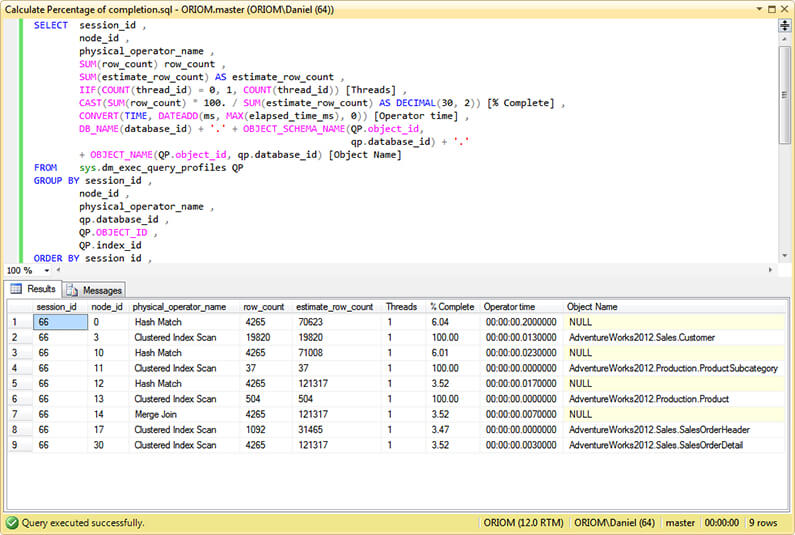
Calculate Estimated Percentage of Completion
We can get an idea about the estimated percentage of completion of our query by looking at the percentage of completion of its physical operators. But you won't find that information in a column of the sys.dm_exec_query_profiles Dynamic Management View. We have to do some basic math using the estimate_row_count and row_count columns by assuming that estimate_row_count represents the 100 percent of the task.
Here we have an issue; the reliability of that percentage is given by the accuracy of the estimation of rows given by the Query Optimizer and this depends on how up to date our statistics are. But even if the statistics are up to date the Optimizer can overestimate or underestimate the cardinality of results, so don't be alarmed if you get a percentage of completion higher than 100.
The following query will give us the percentage of completion for every physical operator in the Query Plan, the number of threads used by each operator, the time spent by operator and its dependent objects if applicable.
SELECT  session_id ,
        node_id ,
        physical_operator_name ,
        SUM(row_count) row_count ,
        SUM(estimate_row_count) AS estimate_row_count ,
        IIF(COUNT(thread_id) = 0, 1, COUNT(thread_id)) [Threads] ,
        CAST(SUM(row_count) * 100. / SUM(estimate_row_count) AS DECIMAL(30, 2)) [% Complete] ,
        CONVERT(TIME, DATEADD(ms, MAX(elapsed_time_ms), 0)) [Operator time] ,
        DB_NAME(database_id) + '.' + OBJECT_SCHEMA_NAME(QP.object_id,
                                                        qp.database_id) + '.'
        + OBJECT_NAME(QP.object_id, qp.database_id) [Object Name]
FROM    sys.dm_exec_query_profiles QP
GROUP BY session_id ,
        node_id ,
        physical_operator_name ,
        qp.database_id ,
        QP.OBJECT_ID ,
        QP.index_id
ORDER BY session_id ,
        node_id
GO
The next screen capture is the output of the analysis of the query we previously defined as our profiling subject.
View Operator's Associated Task Status
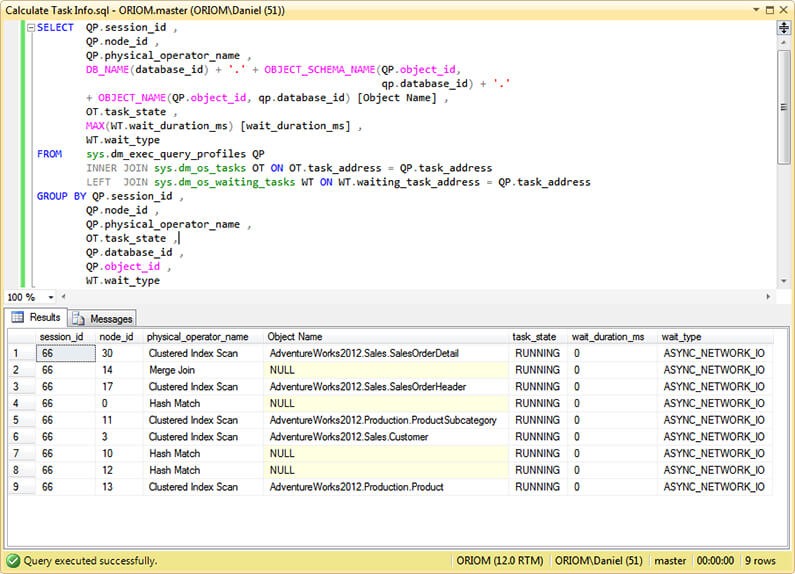
The sys.dm_exec_query_profiles Dynamic Management View can be joined with sys.dm_os_tasks and sys.dm_os_waiting_tasks by using the task_address column. Look at the next query.
SELECT  QP.session_id ,
        QP.node_id ,
        QP.physical_operator_name ,
        DB_NAME(database_id) + '.' + OBJECT_SCHEMA_NAME(QP.object_id,
                                                        qp.database_id) + '.'
        + OBJECT_NAME(QP.object_id, qp.database_id) [Object Name] ,
        OT.task_state ,
        MAX(WT.wait_duration_ms) [wait_duration_ms] ,
        WT.wait_type
FROM    sys.dm_exec_query_profiles QP
        INNER JOIN sys.dm_os_tasks OT
   ON OT.task_address = QP.task_address
        LEFT  JOIN sys.dm_os_waiting_tasks WT
   ON WT.waiting_task_address = QP.task_address
GROUP BY QP.session_id ,
        QP.node_id ,
        QP.physical_operator_name ,
        OT.task_state ,
        QP.database_id ,
        QP.object_id ,
        WT.wait_type
GO
As you can see on the image below with the previous query we have information about the task state for every physical operator, its wait type and duration, if applicable.
Next Steps
- If you want to run the code in this tip you need to download the AdventureWorks2012 database from CodePlex for free at this link - http://msftdbprodsamples.codeplex.com/releases/view/55330.
- In this tip you have an overview of the New SQL Server 2014 Dynamic Management Views.
- To get more information and learn to create a server trace by yourself this Profiler and Server Side Traces tutorial will help.
- If you don't know too much about Extended Events in this tip you have An Overview of Extended Events in SQL Server.
- Take a look at Dynamic Management Views and Functions Tips Category.


About the author
 Daniel Farina was born in Buenos Aires, Argentina. Self-educated, since childhood he showed a passion for learning.
This author pledges the content of this article is based on professional experience and not AI generated.
View all my tips
