By: Ben Snaidero | Comments (4) | Related: > Performance Tuning
Problem
As much as I like some of the graphical tools provided by Microsoft for SQL Server or the full blown applications provided by third party vendors that can be used to help you find and tune poor performing T-SQL code. There are some of us that prefer doing things the old fashioned way, by just using our own T-SQL to perform the same tasks. This tip will give you an overview of how this can be accomplished.
Solution
Sample Table Setup
-- Table creation logic
CREATE TABLE testtable ([col1] [int] NOT NULL primary key,
                        [col2] [int] NULL,
                        [col3] [int] NULL,
                        [col4] [varchar](50) NULL);

-- Populate table
DECLARE @val INT
SELECT @val=1
WHILE @val <= 200000
BEGIN
   INSERT INTO testtable (col1, col2, col3, col4)
       VALUES (@val,@val % 10,@val,'TEST' + CAST(@val AS VARCHAR))
   SELECT @val=@val+1
END
GO

SELECT * FROM [testtable] WHERE [col3]=11493
GO
Query Tuning Process
The first thing we need to do is scour our system to see if there are any poor performing sql queries. To find these queries we could start up SQL Profiler and let it run for hours collecting sql statements (I am always a bit weary of letting Profiler run for a really long time on a production system), but instead let's use a DMV to collect this information. The sys.dm_exec_query_stats DMV stores performance statistics for any of the queries that have a plan cached in our SQL Server instance. It's important to note that when a plan is removed from the cache so are all of its statistics. Joining this view with the sys.dm_exec_sql_text table-valued function we can get a list of all the queries cached in our system and the respective performance statistics. Here is an example of a query to gather this information.
SELECT SUBSTRING(dest.text, (deqs.statement_start_offset/2)+1,
        ((CASE deqs.statement_end_offset
          WHEN -1 THEN DATALENGTH(dest.text)
         ELSE deqs.statement_end_offset
         END - deqs.statement_start_offset)/2)+1) as query,
deqs.execution_count,
deqs.total_logical_reads/deqs.execution_count as "Avg Logical Reads",
deqs.total_elapsed_time/deqs.execution_count as "Avg Elapsed Time",
deqs.total_worker_time/deqs.execution_count as "Avg Worker Time"
FROM sys.dm_exec_query_stats deqs
CROSS APPLY sys.dm_exec_sql_text(deqs.sql_handle) dest
WHERE dest.encrypted=0
We can filter this further by adding an ORDER BY clause and sort it by CPU, elapsed time or reads, whichever we are most concerned about. Below are a few examples of these filters. You could also add a TOP clause to the SELECT list to reduce the result set further.
ORDER BY deqs.total_worker_time/deqs.execution_count DESC
ORDER BY deqs.total_elapsed_time/deqs.execution_count DESC
ORDER BY deqs.total_logical_reads/deqs.execution_count DESC
Here is a sample output from running this query and sorting it by the average number of logical reads and using TOP 1 in the select list.
| query | execution_count | Avg Logical Reads | Avg Elapsed Time | Avg Worker Time |
|---|---|---|---|---|
| SELECT * FROM [testtable] WHERE [col3]=@1 | 1 | 1206 | 32226 | 14648 |
Now that we have a query that we want to try and tune let's take a look at some off the tools we can use to tune and measure the performance of this query.
The first thing we need to do is get a baseline for the performance of our current query. When I do any performance testing (not in production) I also always run "DBCC DROPCLEANBUFFERS" to make sure we have a clean system before starting. Next, to get the baseline numbers, we'll use the "SET STATISTICS TIME ON" command, which will give us information on parse, compile and execution times (in milliseconds) and the "SET STATISTICS IO ON" command, which will give us some information on the amount of disk activity that was required to execute the query. Below is a sample output after running the query we identified above.
SQL Server parse and compile time:
   CPU time = 0 ms, elapsed time = 0 ms.

SQL Server parse and compile time:
   CPU time = 0 ms, elapsed time = 0 ms.

Table 'testtable'. Scan count 1, logical reads 1206, physical reads 3,
   read-ahead reads 1183, lob logical reads 0, lob physical reads 0,
   lob read-ahead reads 0.

SQL Server Execution Times:
   CPU time = 31 ms,  elapsed time = 41 ms.
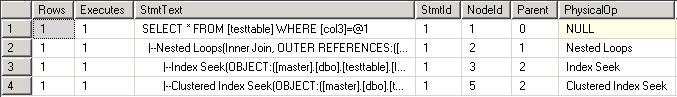
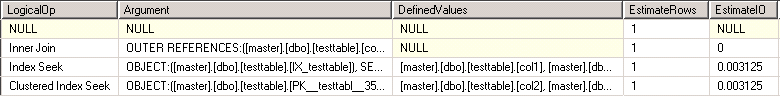
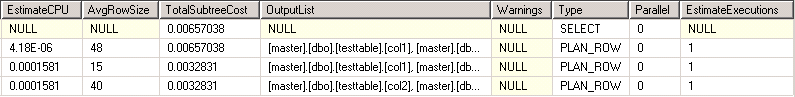
Now that we have some baseline numbers the next step is to take a look at the explain plan for this query as well as the execution steps it has to perform. To capture the explain plan we can run the "SET STATISTICS XML ON" command before running our query. To generate the execution steps we can run the "SET STATISTICS PROFILE ON" command before running our query. Below is a sample output of what having each option enabled produces.
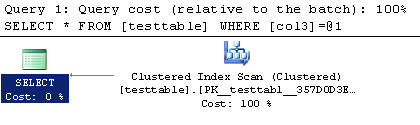


We can see from the plans above that this query is doing an index scan which means there is no index on the col3 column. Let's add one and see if there is a difference. Here is the T-SQL to add the index.
CREATE NONCLUSTERED INDEX [IX_testtable] ON testtable ([col3] ASC);
After creating this index lets again take a look at the explain plan and executions steps output generated by having the SET STATISTICS XML" and "SET STATISTICS PROFILE options set to ON. Note: These options only have to be enabled once in your session so to get an updated output you just have to execute the query again.
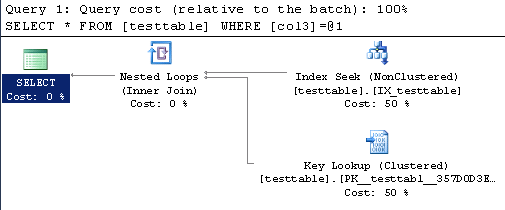
Looking at these outputs we can see that our query is now using the index. Let's check how much of a performance improvement we get by looking at the output that "SET STATISTICS XML" and "SET STATISTICS PROFILE" provided.
SQL Server parse and compile time:
   CPU time = 0 ms, elapsed time = 2 ms.

SQL Server parse and compile time:
   CPU time = 0 ms, elapsed time = 0 ms.

Table 'testtable'. Scan count 1, logical reads 5, physical reads 5,
   read-ahead reads 0, lob logical reads 0, lob physical reads 0,
   lob read-ahead reads 0.

SQL Server Execution Times:
   CPU time = 0 ms,  elapsed time = 3 ms.
So there you have it, using just T-SQL we were able to identify and fix a poor performing SQL statement in SQL Server.
Next Steps
- How to collect and store poor performing sql for analysis
- More information on reading explain plans.
- More tips on SQL Server Performance Tuning


About the author
 Ben Snaidero has been a SQL Server and Oracle DBA for over 10 years and focuses on performance tuning.
This author pledges the content of this article is based on professional experience and not AI generated.
View all my tips
