By: Daniel Farina | Comments (1) | Related: > In Memory OLTP
Problem
Considering that SQL Server 2014 Natively Compiled Stored Procedures are compiled into binary code, you may have asked yourself if it's possible to monitor statement execution. In this tip I will explain how you can monitor SQL Server Natively Compiled Stored Procedures.
Solution
With the arrival of Natively-Compiled Stored Procedures and In-Memory Optimization for SQL Server we have to adapt the way we do complete particular tasks. Both DBA's and Developers have encountered things we have done for years for disk based tables that do not apply to the new In-Memory OLTP Engine inside of SQL Server 2014.
If you are a SQL Developer, a problem you may encounter while migrating or writing new code is the lack of support for PRINT statements on Natively Compiled Stored Procedures. A common practice amongst SQL Server Developers is to use PRINT statements within the code to view the program's flow. Furthermore, another way we debug Stored Procedure execution is by using SQL Profiler and setting up a trace selecting the SP:StmtCompleted event. But with Natively Compiled Stored Procedures this won't work. So it seems that we will have to use SELECT statements within our code to follow our program's flow for debugging.
If you are a DBA and want to get performance metrics of Natively Compiled Stored Procedures you have two other ways to troubleshoot resource consumption at a statement level.
- Creating an Extended Events Session with event sp_statement_completed
- Querying the Dynamic Management Views sys.dm_exec_procedure_stats to get execution statistics of Natively-Compiled Stored Procedures and sys.dm_exec_query_stats to dig into the statements of the procedures.
If you go with the DMV approach, you will find that at first it doesn't seem to work. That's because SQL Server by default doesn't keep track of execution statistics for Natively Compiled Stored Procedures. Keep reading and you will find how to use both methods.
Sample SQL Server Natively Compiled Tables and Stored Procedures
Let's create a sample database.
USE [master]
GO

CREATE DATABASE [SampleDB]
 CONTAINMENT = NONE
 ON  PRIMARY
( NAME = N'SampleDB_file1',
   FILENAME = N'E:\MSSQL\SampleDB_1.mdf',
   SIZE = 128MB ,
   MAXSIZE = UNLIMITED,
   FILEGROWTH = 64MB),
 FILEGROUP [SampleDB_MemoryOptimized_filegroup]
   CONTAINS MEMORY_OPTIMIZED_DATA  DEFAULT
( NAME = N'SampleDB_MemoryOptimized',
    FILENAME = N'E:\MSSQL\SampleDB_MemoryOptimized',
    MAXSIZE = UNLIMITED)
 LOG ON
( NAME = N'SampleDB_log_file1',
    FILENAME = N'E:\MSSQL\SampleDB_1.ldf',
    SIZE = 64MB,
    MAXSIZE = 2048GB,
    FILEGROWTH = 32MB)
GO
The next script will create a sample In-Memory table.
USE SampleDB
GO

IF OBJECT_ID('dbo.SampleTable','U') IS NOT NULL
    DROP TABLE dbo.SampleTable
GO

CREATE TABLE SampleTable
    (
      ID INT IDENTITY(1,1),
   A INT NULL,
   B INT NULL,
   C INT NULL,
   Outcome DECIMAL(10,2) NULL

        CONSTRAINT PK_SampleTable
        PRIMARY KEY NONCLUSTERED HASH ( id )
   WITH ( BUCKET_COUNT = 1024 )
    ) WITH (MEMORY_OPTIMIZED =
   ON,
   DURABILITY = SCHEMA_AND_DATA)
GO
This script will insert a few rows into our previously created table.
USE SampleDB
GO

INSERT INTO dbo.SampleTable
        ( A, B, C, Outcome )
VALUES  ( 20, -- A - int
          0, -- B - int
          15, -- C - int
          NULL
          )

INSERT INTO dbo.SampleTable
        ( A, B, C, Outcome )
VALUES  ( 65, -- A - int
          100, -- B - int
          0, -- C - int
          NULL
          )

INSERT INTO dbo.SampleTable
        ( A, B, C, Outcome )
VALUES  ( 0, -- A - int
          50, -- B - int
          29, -- C - int
          NULL
          )

GO
And finally here is the code for the stored procedure.
USE SampleDB
GO

IF OBJECT_ID('dbo.SampleSP','P') IS NOT NULL
   DROP PROCEDURE dbo.SampleSP
GO

CREATE PROCEDURE dbo.SampleSP
 @Param int
WITH NATIVE_COMPILATION, SCHEMABINDING, EXECUTE AS OWNER
AS BEGIN ATOMIC WITH
(
 TRANSACTION ISOLATION LEVEL = SNAPSHOT, LANGUAGE = N'us_english'
)
IF @Param > 0
BEGIN
    UPDATE  dbo.SampleTable
        SET     Outcome =  ( A + B + C ) / CAST(@Param AS NUMERIC(10,2) )

        SELECT Outcome
            FROM dbo.SampleTable
END
ELSE
IF @Param = 0
BEGIN
    ;THROW 51000, 'Invalid Parameter', 1;
END
ELSE
    BEGIN
        UPDATE  dbo.SampleTable
            SET     Outcome =  ( A - B - C ) / CAST(@Param  AS NUMERIC(10,2) )
    END

SELECT Outcome
FROM dbo.SampleTable
END
GO
Now we are ready to begin.
Extended Events to Monitor SQL Server 2014 Natively Compiled Stored Procedures
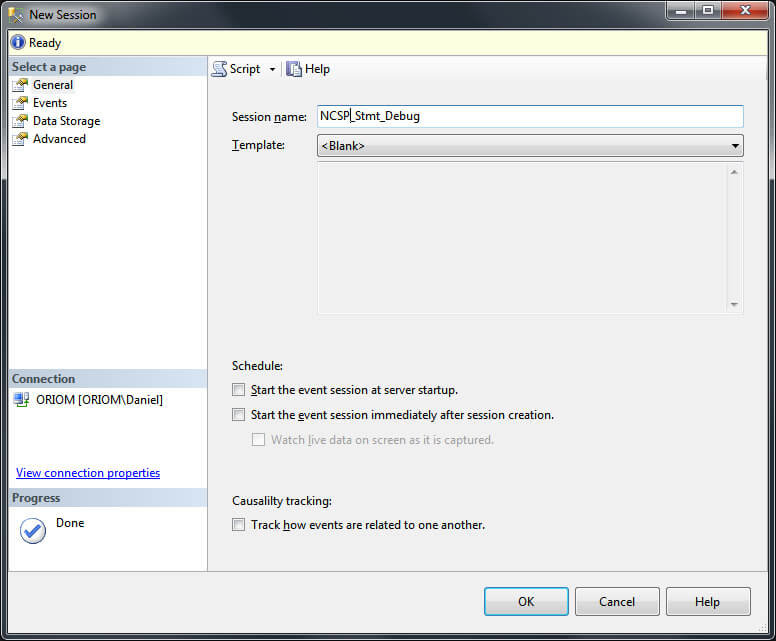
As I mentioned previously, to dig into the executed statements of a Natively Compiled Stored Procedure we have to setup an Extended Events Session and configured with the sp_statement_completed event. To do so with Management Studio just browse folder /Management/Extended Events, right click into Sessions and in the contextual menu select "New Session".
When the New Session window loads choose a blank template like in the image below.
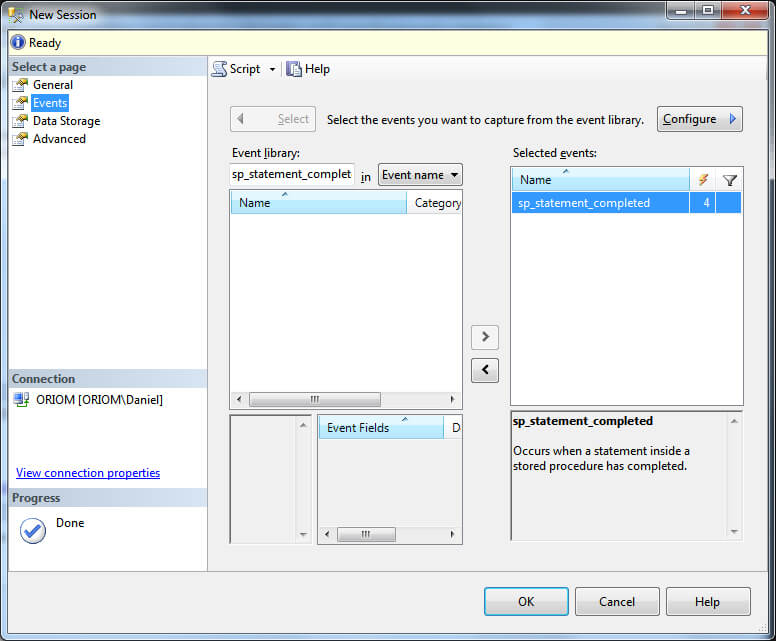
On the Events Page search in the Event Library for event sp_statement_completed, add it to Selected Events List and press the Configure button.
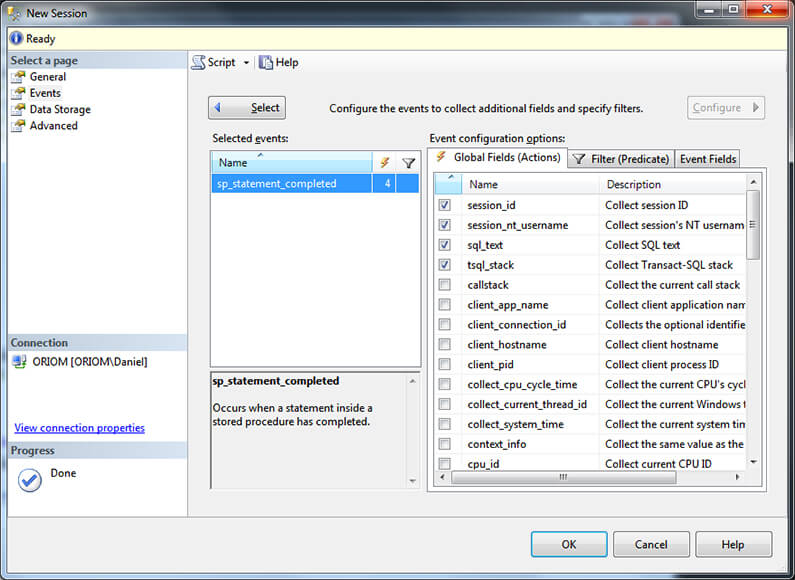
Now in the Global Fields tab mark the check boxes of the fields shown in the image below.
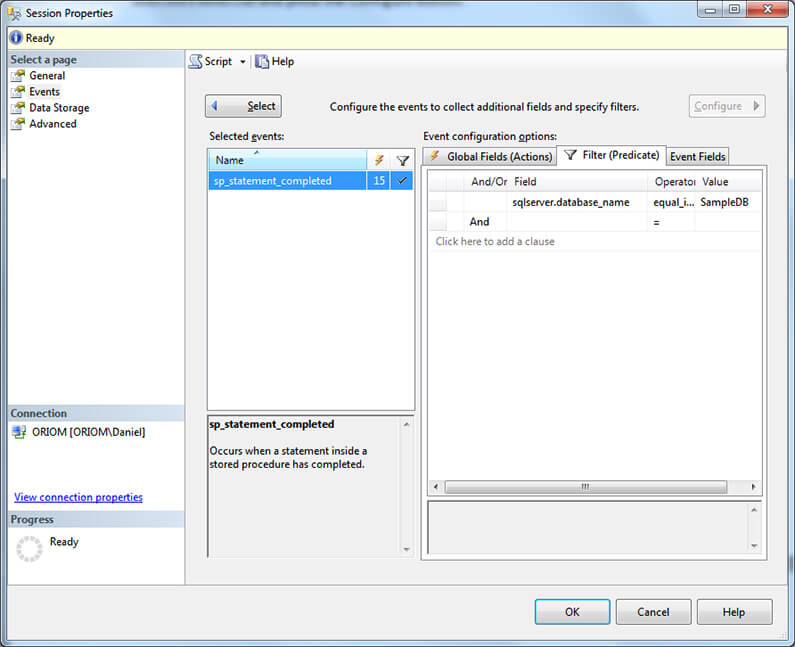
To setup a filter for our SampleDB use the filter tab as shown in the next image.
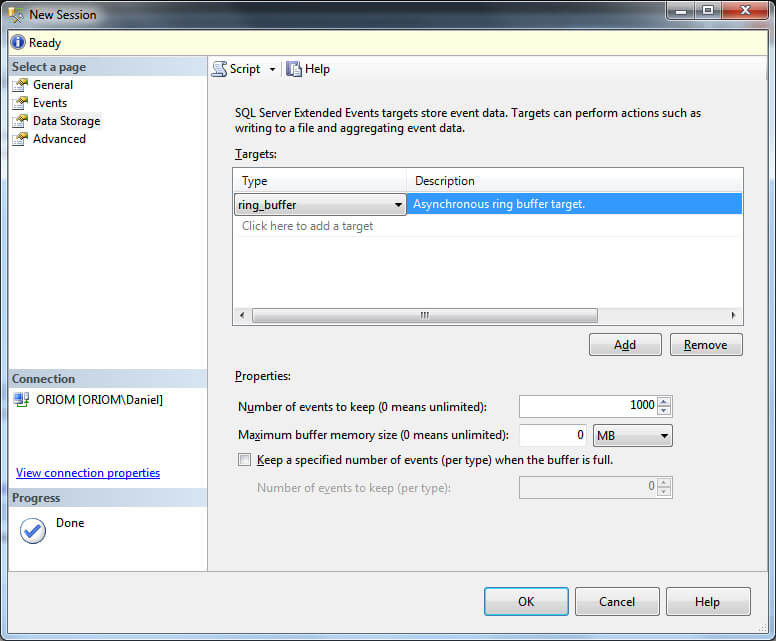
On the Data Storage Page select Ring Buffer as a target.
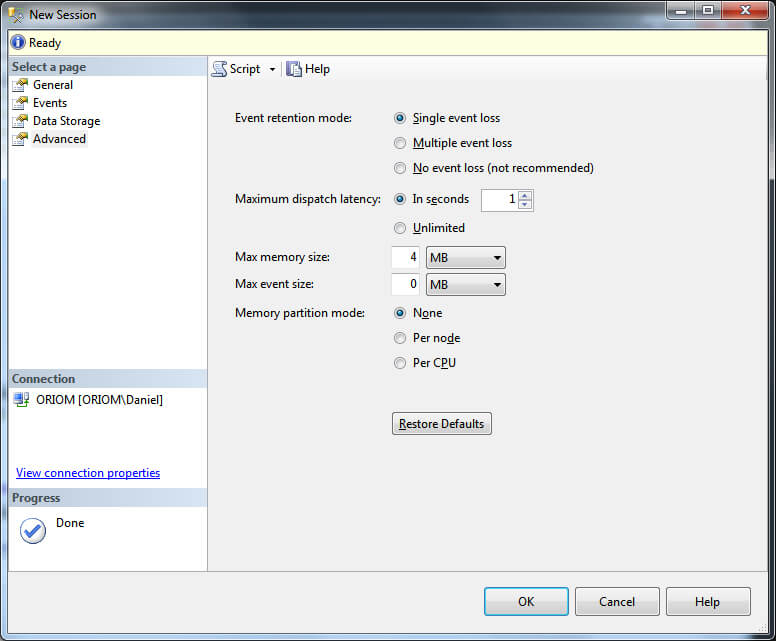
On the Advanced Page alter the default value for "Maximum Dispatch Latency" to 1 second.
T-SQL Code to Create the Extended Events to Monitor Natively Compiled Stored Procedures
Also if you prefer, you can create this Extended Events Session with the following T-SQL script.
USE master
GO

CREATE EVENT SESSION [NCSP_Stmt_Debug] ON SERVER
ADD EVENT sqlserver.sp_statement_completed ( SET collect_object_name = ( 1 ) ,
                                              collect_statement = ( 1 )
    ACTION ( sqlserver.session_id, sqlserver.session_nt_username,
    sqlserver.sql_text, sqlserver.tsql_stack ) )
ADD TARGET package0.ring_buffer
WITH ( MAX_DISPATCH_LATENCY = 1 SECONDS )
GO

GO
T-SQL Code to Start the Extended Events Session
We run the following code to start this Extended Events Session.
USE master
GO

ALTER EVENT SESSION [NCSP_Stmt_Debug] ON SERVER STATE = START
GO
Now we are ready to execute our Natively-Compiled Stored Procedure.
USE SampleDB
GO

EXEC dbo.SampleSP @Param = 54
GO
The next image is a screen capture of the live Extended Events data.
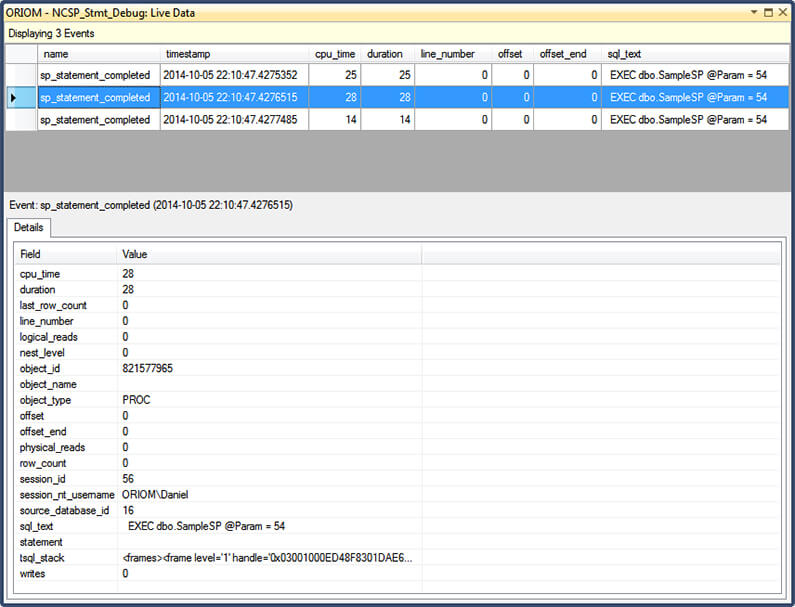
As you can see, it doesn't give us too much information, so let's see how things look with the DMV approach.
Using Dynamic Management Views to Monitor Natively Compile Stored Procedures
Since the introduction of Dynamic Management Views in SQL Server 2005, we have been using the sys.dm_exec_query_stats DMV to get statistical information about cached query plans and the sys.dm_exec_procedure_stats DMV which was introduced in SQL Server 2008 to do the same with cached Stored Procedure plans.
But as I mentioned earlier, if you query these DMVs to get information about Natively Compiled Stored Procedures you will notice that they don't return any data. That's because according to Microsoft, collecting statistics of Natively Compiled Stored Procedures has a performance impact, so it has to be enabled.
Enable Statistics Collection for SQL Server Natively Compiled Stored Procedures
Enabling statistics collection for all Natively Compiled Stored Procedures can be done using the sys.sp_xtp_control_proc_exec_stats stored procedure which returns information about the current statistics collection status for the instance. Because of this, if you want to troubleshoot a single Natively Compiled Stored Procedure maybe this isn't the best choice.
This procedure has the following parameters, both of them are optional.
Parameter |
Data Type |
Description |
|---|---|---|
@new_collection_value |
BIT |
It is used to set the desired state of statistics collection. |
@old_collection_value |
BIT |
This is an OUTPUT parameter whose is used to return the current status of statistics collection |
This script shows how to enable statistics collection for all Natively Compiled Stored Procedures.
USE master
GO

-- This will enable statistics collection
EXEC sys.sp_xtp_control_proc_exec_stats @new_collection_value = 1
GO
This is how to query for the current status.
USE master
GO

-- This will show current status
DECLARE @CurrentStatus BIT

EXEC sys.sp_xtp_control_proc_exec_stats
    @old_collection_value = @CurrentStatus OUTPUT

SELECT @CurrentStatus
GO
After re-executing our Natively-Compiled Stored Procedure, we can query its execution statistics with the next query.
USE SampleDB
GO

SELECT  PS.object_id ,
        OBJECT_NAME(PS.object_id) AS 'object name' ,
        cached_time ,
        last_execution_time ,
        execution_count ,
        total_worker_time ,
        total_elapsed_time
FROM    sys.dm_exec_procedure_stats PS
        INNER JOIN sys.all_sql_modules SM
   ON SM.object_id = PS.object_id
WHERE   SM.uses_native_compilation = 1
GO
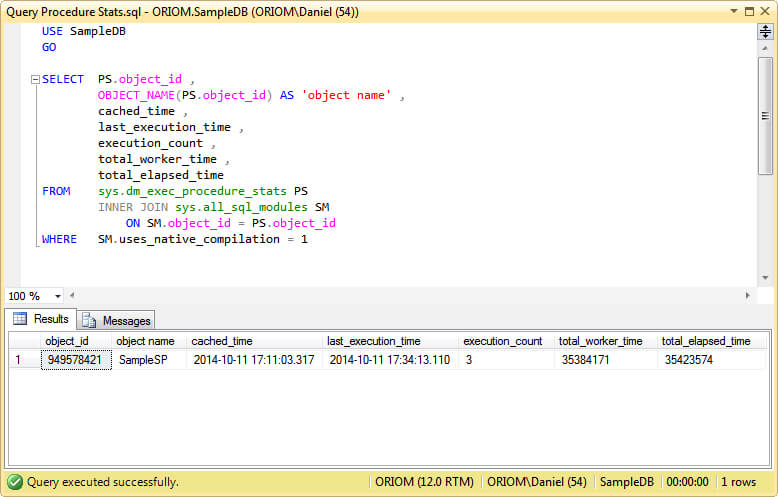
This is a screen capture showing the output of the previous query.
Enable Statistics Collection for a specific Natively Compiled Stored Procedures
Unlike the previous system stored procedure, the sys.sp_xtp_control_query_exec_stats stored procedure enables query statistics collection for individual Natively Compiled Stored Procedures. It has the advantage of allowing us to set statistics collection status for a specific Natively-Compiled Stored Procedure to reduce the performance impact. A requirement is that the procedure must have been executed prior to enabling the query statistics collection.
This table shows the parameters, all of them are optional, but if you specify a value for @database_id you have to also specify @xtp_object_id.
Parameter |
Data Type |
Description |
|---|---|---|
@new_collection_value |
BIT |
It is used to set the desired state of statistics collection. |
@database_id |
INT |
The ID of the database to enable statistics collection. |
@xtp_object_id |
INT |
The object ID of the Natively-Compiled Stored Procedure to enable statistics collection. |
@old_collection_value |
BIT |
This is an OUTPUT parameter whose is used to return the current status of statistics collection. |
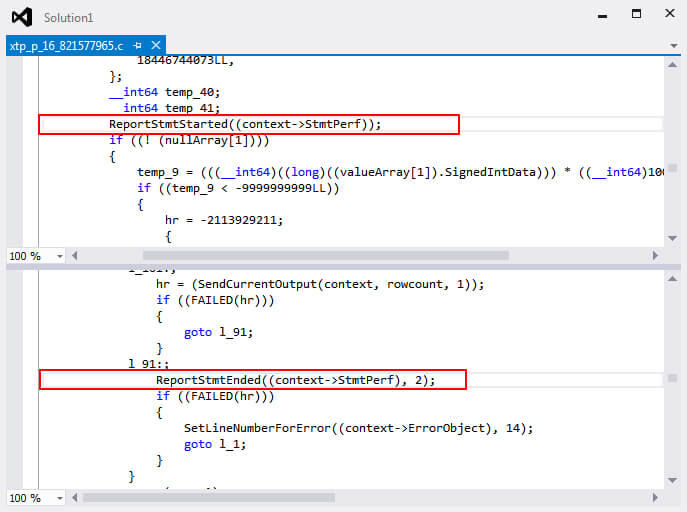
Something important to note is that you don't need to drop and re-create the procedure before changing the statistics collection status. If you have some background in C programming you can see on the next screen the captured C code generated automatically by the In-Memory OLTP Engine. In this code you can see a call to a function called ReportStmtStarted and then another function, ReportStmtEnded that is called before and after executing a statement.
The next set of code will enable statistics collection for the statements of our previously created Natively Compiled Stored Procedure. If you want to enable this for the entire instance set @database_id and @xtp_object_id to NULL or just omit those parameters.
USE SampleDB
GO

DECLARE @Database INT
DECLARE @SP INT

SELECT  @Database = DB_ID('SampleDB') ,
        @SP = OBJECT_ID('SampleSP')

EXEC sys.sp_xtp_control_query_exec_stats @new_collection_value = 1, -- bit
    @database_id = @Database, -- int
    @xtp_object_id = @SP

GO
Now we check the status of statistics collection of our Procedure.
USE SampleDB
GO

DECLARE @CurrentStatus BIT
DECLARE @Database  INT
DECLARE @SP    INT

SELECT  @Database = DB_ID('SampleDB') ,
        @SP = OBJECT_ID('SampleSP')

-- This will show current status for a single SP
EXEC sys.sp_xtp_control_query_exec_stats
    @database_id = @Database, -- int
    @xtp_object_id = @SP, -- int
    @old_collection_value = @CurrentStatus OUTPUT-- bit

SELECT @CurrentStatus [Object Current Status]

GO
Also if we execute the next script we can see the status for the instance.
USE SampleDB
GO

-- This will show current status for the Instance
DECLARE @CurrentStatus BIT

EXEC sys.sp_xtp_control_query_exec_stats
    @old_collection_value = @CurrentStatus OUTPUT

SELECT @CurrentStatus AS [Instance Current Status]

GO
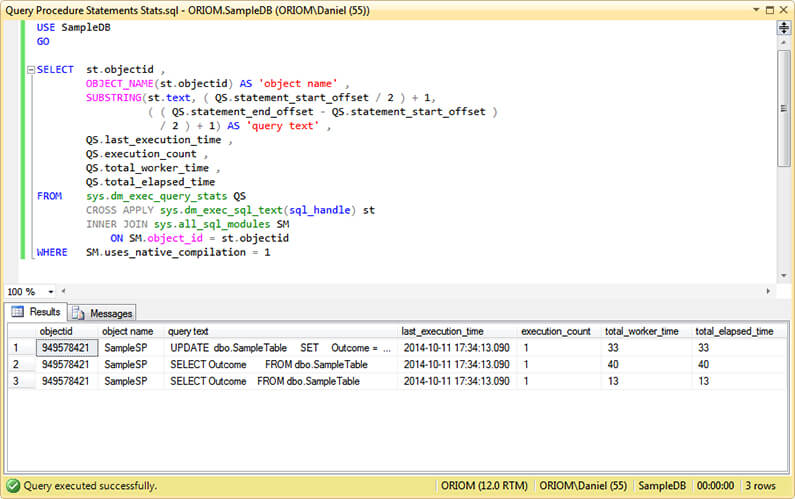
If we execute our Procedure again we can query its statements statistics with the next script.
USE SampleDB
GO

SELECT  st.objectid ,
        OBJECT_NAME(st.objectid) AS 'object name' ,
        SUBSTRING(st.text, ( QS.statement_start_offset / 2 ) + 1,
                  ( ( QS.statement_end_offset - QS.statement_start_offset )
                    / 2 ) + 1) AS 'query text' ,
        QS.last_execution_time ,
        QS.execution_count ,
        QS.total_worker_time ,
        QS.total_elapsed_time
FROM    sys.dm_exec_query_stats QS
        CROSS APPLY sys.dm_exec_sql_text(sql_handle) st
        INNER JOIN sys.all_sql_modules SM
   ON SM.object_id = st.objectid
WHERE   SM.uses_native_compilation = 1

GO
The next screen capture shows the output of the previous query.
Next Steps
- If you are new to Natively Compiled Stored Procedures then read my previous tip Migrate to Natively Compiled SQL Server Stored Procedures for Hekaton to get started.
- You can read the following tip to go deeper into query statistics collection: Collecting Query Statistics for SQL Server 2005.
- You can read more tips about DMV's check out the Dynamic Management Views and Functions Tips Category.


About the author
 Daniel Farina was born in Buenos Aires, Argentina. Self-educated, since childhood he showed a passion for learning.
This author pledges the content of this article is based on professional experience and not AI generated.
View all my tips
