By: Brian P ODwyer | Comments (4) | Related: > Virtualization
Problem
We have gone to almost all virtualized SQL Servers and as a result finding accurate information on the underlying hardware that the virtualized servers are running on can be difficult. We may also desire to know more about the VMWare configuration and how it affects our SQL Servers. You may have access to the vSphere Client Console or the vSphere Web Client, but if you do not or only limited access; if you have access to the vCenter Database itself you can find the information you are looking for.
Solution
Here are the key questions we want to answer in this tip:
- What is the power plan for my underlying ESXi hosts if they are hosting virtual SQL Servers?
- How many resources (memory CPU, Disk) do the underlying ESXi hosts have and how much capacity is left to add additional guest VMs?
- What is the number of NIC and HBA Adapters on each ESXi hosts?
- What ESXI hosts are hosting my SQL Server guest VMs and how might this affect my SQL Server licensing with SQL 2012 and higher?
This type of information only requires read-only access to the VMware vCenter database and if we combine some of the T-SQL and information from a previous MSSQLTips tip I wrote we should be able to get everything we want to know about the underlying ESXi hardware.
In this process we will look at VMware clusters which are collections of VMware ESXi hosts that combine the underlying physical resources into manageable resource pools as well as being the prerequisites for VMware HA, DRS and FT. We will go over Resource Pools, but for the most part we are interested in the physical configurations of the ESXi hosts and how to extract that data. The total resources of the ESXi hosts provide us with data we need for broad estimates of capacity, but we have to remember the concept of Resource Pools if we want to have a finer view of the capacity limits of the guest VMs on the ESXi hosts. By using Resource Pools, logical mapping of capacity limits to VM guests is accomplished, but this is a complex topic in itself.
It should be stated that this method of finding information from the vSphere vCenter Server database, called VCDB by default unless changed, is not officially supported by VMware. If you are not extremely careful and accidently write to the database, it can result in corruption of the vCenter Server database and failure of the VMware farm and/or features. If you are at all concerned with accessing the vCenter database then use a restored backup, it will have the same information in it and will act as a snapshot in time of the VMware environment. If your VMWare environment is running the VMware vCenter Server Appliance then you will not be able to use these techniques.
Be sure to use WITH (NOLOCK,NOWAIT) when querying the database tables and views if you are reading from the VCDB and not a restored backup.
T-SQL queries for ESXi Host information using the VMware vCenter database views and tables
We will begin by examining the Cluster information for the VMWare Farm and in the process look at the Resource Pool configuration as well, a VMWare Cluster is a Resource Pool as is a Stand-alone ESXi host not in cluster. The next part will cover the physical hardware of the ESXi hosts and what you can see and what you cannot determine such as underlying SAN architecture. After that we examine some of the VMware features that may be enabled and what they mean to the guest VMs and for us as SQL Server Database Administrators. Finally we will take a look at capacity information and how we can use it as well as how to use queries to give us targeted information about where our SQL servers are in the VMware farm and how they use the underlying physical resources of VMware Clusters such as sharing LUNS, CPU and memory allocation and over commitment of resources. All of these topics have a great deal to do with the performance and operational stability of our virtualized SQL servers.
We also have to work within the new Microsoft SQL 2012 and higher licensing schemes so knowing the number of vCPU and the Physical CPUs on a host will allow us to better keep costs inline. If you have an Enterprise Agreement (EA) or Software Assurance (SA) with Enterprise Edition this is good information to have, if not then you definitely need to be aware of the numbers of vCPU and physical CPUs. The location of the SQL Server VM within the VMware farm becomes important, every ESXi host that can host the SQL server VM guest has to be licensed for SQL server. This can be very expensive unless you create VMware clusters for SQL Server which host SQL Server VMs only tracking the location of the SQL Server VMs so that none are created by the other teams on the wrong ESXi hosts (VMware cluster member or stand-alone). This licensing issue is found with other RDBMS and could be the case for other vendor licensing schemes. Now the location of guest VMs becomes important and it becomes even more complex if you have VMWare HA, DRS and FT involved that can automatically change the location of a guest VM outside of the SQL Server Database Administrator's control. As an FYI - if you have Hyper-V then you could have limits on how often you can move a guest VM among Hyper-V hosts depending on the Windows Server licensing you have as well.
SQL Server Queries to Find Cluster and Resource Pool Information for ESXi Hosts
Before we get started in depth we are going to see how you can find Cluster and Resource Pool information from the VCDB. There are several places we can go to find this information, the [VCDB].[dbo].[VPXV_ENTITY] or [VCDB].[dbo].[VPXV_COMPUTE_RESOURCE] views. If we use the VPXV_ENTITY view we have to filter for cluster_compute_resource or compute_resource which will give us the clusters and any standalone ESXi hosts. There is a tremendous amount of data about all the entities (Hosts, VMGuests, vSwitches, etc...) in the VMware Farm in an unfiltered query of [VCDB].[dbo].[VPXV_ENTITY].
USE VCDB;

SELECT
   [ID]
 , [NAME]
 , [TYPE_ID]
 , [ENTITY_TYPE]
 , [PARENT_ID]
 , [PARENT_TYPE_ID]
 , [PARENT_ENTITY_TYPE]
FROM
 [VCDB].[dbo].[VPXV_ENTITY] WITH (NOLOCK,NOWAIT)
WHERE
 [ENTITY_TYPE] = 'CLUSTER_COMPUTE_RESOURCE'
 OR [ENTITY_TYPE] = 'COMPUTE_RESOURCE'

The simpler view to use is [VCDB].[dbo].[VPXV_COMPUTE_RESOURCE] which only looks at Compute Resources, the Clusters and Standalone hosts. This view provides a large amount of data about VMWare HA, DRS, DPM and the configurations of these features.
USE VCDB;

-- see http://www.vmware.com/files/pdf/vc_dbviews_41.pdf pg 13 for information on values
-- http://www.vmware.com/files/pdf/hpm-perf-vsphere5.pdf
-- http://www.vmware.com/files/pdf/Distributed-Power-Management-vSphere.pdf

SELECT
 [RESOURCEPOOLID] -- [ID] in [dbo].[VPXV_ENTITY]
 , [NAME]
 , [PARENT_ID]
 --, [RESOURCE_GROUP_ID]
 , [RESOURCE_TYPE]
 , [VM_SWAP_PLACEMENT]
 --, [SPBM_ENABLED]  -- Storage Policy Based Management
 , [HAMODE]
 , [DRSMODE]
 , [FAILOVER_LEVEL]
 , [STRICT_ADMISSION_CONTROL]
 , [DEFAULT_VM_BEHAVIOR]
 , [VMOTION_RATE]
 , [DPM_ENABLED_FLG]
 , [DEFAULT_HOST_BEHAVIOR]
 , [DEFAULT_DAS_PRIORITY]
 , [POWER_OFF_ON_ISOLATION]
 , [EVC_MODE]
 --, [VMHEALTH_VM_MONITORING]
 --, [VMHEALTH_FAILURE_INTERVAL]
 --, [VMHEALTH_MIN_UPTIME]
 --, [VMHEALTH_MAX_FAILURES]
 --, [VMHEALTH_MAX_FAILURE_WINDOW]
 --, [FAILOVER_CPU_RESOURCES]
 --, [FAILOVER_MEM_RESOURCES]
 , [HOST_POWER_ACTION_RATE]
 , [DRS_VM_OVERRIDES_ENABLED_FLG]
 , [DAS_HOST_MONITORING]
 , [DAS_VM_MONITORING]
 , [CLUSTER_STATE]
FROM
[VCDB].[dbo].[VPXV_COMPUTE_RESOURCE] WITH (NOLOCK,NOWAIT)
;


There is more data returned by the query, but the parts that we are interested in are in these graphics. Whether HA, DRS or DPM features are enabled is shown as is the more important configuration options. I have included links to VMWare documentation in the T-SQL code and I would suggest you read them to get a better understanding and also ask your VMware Admins about them and how they can affect SQL Server guest VMs. The end customer experience can be severely impacted if the configurations are not conducive to SQL Server processing or you have VM guests moving around and/or ESXi hosts shutting down to optimize power savings, but increasing VM guest concentration onto fewer ESXi hosts.
SQL Server Queries for ESXi Host Configurations
Now that we have a better idea of what the compute resources, cluster or standalone, are we can start to work on what the underlying ESXi host configurations look like. We may want a preliminary T-SQL query to give us a list of the guest VMs and which ESXi host they reside on. We will use this list to find our SQL Servers and the ESXi hosts to utilize in WHERE clauses. This part will unfortunately have to be a somewhat manual process, but if you create a table for VM guests and populate with the required information you could use that table with IN in the WHERE clause. An alternative would be to join the [VCDB].[dbo].[VPXV_VMS] view of VM guests with the [VCDB].[dbo].[VPXV_RESOURCE_POOL] view which holds the capacity of the Resource Pools CPU and Memory. We can then join with the [VCDB].[dbo].[VPXV_COMPUTE_RESOURCE] to allow us to map VM guests to VMWare Clusters. There are several ways to do this, how just depends on your familiarity with the views and tables and realizing that sometimes the table primary keys have different foreign key names in different tables for the same key. Below is a simple pull to list VM guests to ESXi hosts.
USE VCDB;

SELECT DISTINCT
   VPG.[NAME] AS VMGuestLogicalName
 , VPH.[NAME] AS ESXIHostName
 , ISNULL(VPG.[DNS_NAME],'') AS DNS_NAME
 , ISNULL(VPG.[IP_ADDRESS],'') AS IP_ADDRESS
FROM
 [VCDB].[dbo].[VPXV_VMS] AS VPG WITH (NOLOCK,NOWAIT)
  INNER JOIN [VCDB].[dbo].[VPXV_HOSTS] AS VPH WITH (NOLOCK,NOWAIT)
   ON VPH.HOSTID = VPG.HOSTID
;

Rather than do a manual pick, if we have already setup our environment with a VMware ESXi cluster for SQL Servers we could use this query where we join on the compute_resource (cluster) to the resource_pool then into the VM guests view.
USE VCDB;

SELECT DISTINCT
   VPG.[NAME] AS VMGuestLogicalName
 , VPH.[NAME] AS ESXIHostName
 , ISNULL(VPG.[DNS_NAME],'') AS DNS_NAME
 , ISNULL(VPG.[IP_ADDRESS],'') AS IP_ADDRESS
 , VCR.NAME AS ClusterName
FROM
 [VCDB].[dbo].[VPXV_VMS] AS VPG WITH (NOLOCK,NOWAIT)
  INNER JOIN [VCDB].[dbo].[VPXV_HOSTS] AS VPH WITH (NOLOCK,NOWAIT)
   ON
    VPH.HOSTID = VPG.HOSTID
  LEFT OUTER  JOIN  [VCDB].[dbo].[VPXV_RESOURCE_POOL] AS VRP WITH (NOLOCK,NOWAIT)
   ON
    VRP.RESOURCEPOOLID = VPG.RESOURCE_GROUP_ID
  LEFT OUTER JOIN  [VCDB].[dbo].[VPXV_COMPUTE_RESOURCE] AS VCR  WITH (NOLOCK,NOWAIT)
   ON
    VCR.RESOURCEPOOLID = VRP.PARENT_ID
WHERE  VCR.NAME = 'ESXi 910 SQL Cluster 5.0'
;
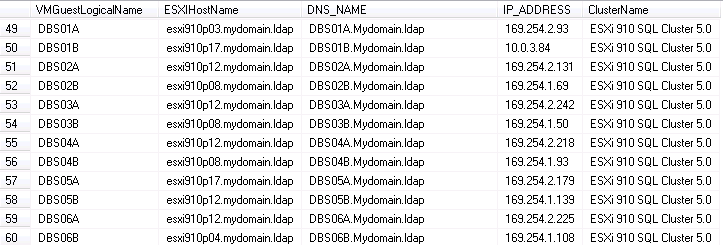
SQL Server Queries for Hardware Model, CPU, Memory, etc. for ESXi host
We can now use an ESXi host list for our SQL Servers or the same FROM clause above to get the ESXi host configuration information for Hardware Model, CPU, Memory, NIC, HBA and percentage of resources that are used by running guest VMs and total resources allocated to all provisioned guest VMs. We also have the total number of guest VMs running on each ESXi host and the state of the VMTools of each, just sum the VMTools columns to find total running guest VMs. I will point out that I modified this query from the original author's (Jonathan Kehayias) version.
USE VCDB;

SELECT DISTINCT
   VPH.NAME AS [HOST_NAME]
 , HOST_MODEL
 , CPU_MODEL
 , CPU_COUNT
 , CPU_CORE_COUNT
 , CPU_THREAD_COUNT
 , SUM(CASE WHEN VPG.POWER_STATE = N'On' THEN VPG.NUM_VCPU ELSE 0 END) AS VM_VCPU_ACTIVE
 , CAST(SUM(CASE WHEN VPG.POWER_STATE = N'On' THEN VPG.NUM_VCPU ELSE 0 END)*1.0/CPU_THREAD_COUNT AS DECIMAL(6,5))*100 AS Thread_OverCommitPercent
 , CAST(SUM(CASE WHEN VPG.POWER_STATE = N'On' THEN VPG.NUM_VCPU ELSE 0 END)*1.0/CPU_CORE_COUNT AS DECIMAL(6,5))*100 AS Core_OverCommitPercent
 , CAST(MEM_SIZE AS BIGINT)/1024/1024/1024 AS MEM_SIZE_GB
 , SUM(CASE WHEN VPG.POWER_STATE = N'On' THEN VPG.MEM_SIZE_MB ELSE 0 END)/1024 AS VM_MEM_SIZE_GB
 , (CAST(MEM_SIZE AS BIGINT)/1024/1024/1024) - (SUM(CASE WHEN VPG.POWER_STATE = N'On' THEN VPG.MEM_SIZE_MB ELSE 0 END)/1024) AS Memory_AvailGB
 , CAST(SUM(CASE WHEN VPG.POWER_STATE = N'On' THEN VPG.MEM_SIZE_MB ELSE 0 END)*1.0/(CAST(MEM_SIZE AS BIGINT)/1024/1024) AS DECIMAL(6,5))*100 AS MEM_OVERCommitPercent
 , SUM(CAST(VPG.MEMORY_OVERHEAD AS BIGINT))/1024/1024 AS VM_MEMORY_OVERHEAD_MB
 , SUM(VPG.MEM_SIZE_MB)/1024 AS VM_MEM_SIZE_GB_POTENTIAL
 , SUM(VPG.NUM_VCPU) AS VM_VCPU_ALLOC_POTENTIAL
 , NIC_COUNT
 , HBA_COUNT
 , SUM(CASE WHEN VPG.VMMWARE_TOOL = N'OK' THEN 1 ELSE 0 END) AS VM_TOOLS_OK
 , SUM(CASE WHEN VPG.VMMWARE_TOOL = N'Old' THEN 1 ELSE 0 END) AS VM_TOOLS_OUT_OF_DATE
 , SUM(VPG.NUM_VCPU) AS VM_VCPU_ALLOC

FROM
 [VCDB].[dbo].[VPXV_VMS] AS VPG WITH (NOLOCK,NOWAIT)
  INNER JOIN [VCDB].[dbo].[VPXV_HOSTS] AS VPH WITH (NOLOCK,NOWAIT)
   ON
    VPH.HOSTID = VPG.HOSTID
  LEFT OUTER  JOIN  [VCDB].[dbo].[VPXV_RESOURCE_POOL] AS VRP WITH (NOLOCK,NOWAIT)
   ON
    VRP.RESOURCEPOOLID = VPG.RESOURCE_GROUP_ID
  LEFT OUTER JOIN  [VCDB].[dbo].[VPXV_COMPUTE_RESOURCE] AS VCR  WITH (NOLOCK,NOWAIT)
   ON
    VCR.RESOURCEPOOLID = VRP.PARENT_ID
WHERE  VCR.NAME = 'ESXi 910 SQL Cluster 5.0'

GROUP BY
   VPH.NAME
 , HOST_MODEL
 , CPU_MODEL
 , CPU_COUNT
 , CPU_CORE_COUNT
 , CPU_HZ
 , CPU_THREAD_COUNT
 , MEM_SIZE
 , NIC_COUNT
 , HBA_COUNT
;


The data returned tells us how much of any resource we have allocated; we would like the percentages to be under 100%, but looking at the CPU cores to vCPU cores we have to take into account the CPU HyperThreading. The Thread Overcommit % does tell us that we have more vCPU cores than HyperThreads which could lead to performance issues; ideally we want this less than 100%. We would also prefer to have any potential allocated resources to be less than 100%. We should notice that there is overhead used by the ESXi host to manage the guest VM memory, the mapping of virtual to physical memory address spaces. The number of HBAs and NICs gives us an estimate of the throughput capacity and HA/FT capability for these physical resources on the ESXi host itself nice things to know if we are experiencing performance issues or want to make sure we have fault tolerance. We can additionally determine if and how features like vMotion, DRS and FT could be used in our environment, but you need to work with the VMWare and Storage teams and not against them. A good webcast on virtualizing SQL Server by Robert L. Davis can be found here which deals with these topics in detail.
SQL Server Queries for Power Policy, VMWare Version and Build Information for ESXi Host
We can also get power policy, VMWare version and build information and more configuration information with another similar T-SQL query. If you watch Robert Davis' webcast you will understand about the power policy of the ESXi host and how it can affect performance. I purposefully included both NAME and DNS_NAME to point out the logical, NAME, and physical, DNS_NAME, of each ESXi host which can be different, so if that is the case you should work with the VMWare Administrator to make them match up for standardization reasons if nothing else.
 USE VCDB;

SELECT
   VPH.[NAME]
 , VPH.[DNS_NAME]
 , VPH.[ENABLED]
 , VPH.[VMOTION_ENABLED] AS VMOTION
 , VPH.[HOST_VENDOR] AS VENDOR
 , VPH.[HOST_MODEL] AS MODEL
 , VPH.[CPU_MODEL]
 , VPH.[CPU_COUNT]
 , VPH.[CPU_CORE_COUNT] AS CPU_CORE
 , VPH.[CPU_THREAD_COUNT] AS CPU_THREADS  -- if hyperthreaded CPU this will be twice CPU_CORE
 , VPH.[CPU_POWER_MGMT_POLICY] AS POWER_MGMT
 , VPH.[CPU_POWER_MGMT_SUPPORT] AS PWR_MGMT_SUPPORT
 , CAST(VPH.[MEM_SIZE] AS BIGINT)/(1024*1024*1024) AS MEM_SIZE_GB
 , VPH.[BOOT_TIME]
 , VPH.[PRODUCT_VERSION] AS [VERSION]
 , VPH.[PRODUCT_BUILD] AS [BUILD]
 , VPH.[IP_ADDRESS]
 , VPH.[NIC_COUNT] AS NICs
 , VPH.[HBA_COUNT] AS HBAs
FROM
 [VCDB].[dbo].[VPXV_VMS] AS VPG WITH (NOLOCK,NOWAIT)
  INNER JOIN [VCDB].[dbo].[VPXV_HOSTS] AS VPH WITH (NOLOCK,NOWAIT)
   ON
    VPH.HOSTID = VPG.HOSTID
  LEFT OUTER  JOIN  [VCDB].[dbo].[VPXV_RESOURCE_POOL] AS VRP WITH (NOLOCK,NOWAIT)
   ON
    VRP.RESOURCEPOOLID = VPG.RESOURCE_GROUP_ID
  LEFT OUTER JOIN  [VCDB].[dbo].[VPXV_COMPUTE_RESOURCE] AS VCR  WITH (NOLOCK,NOWAIT)
   ON
    VCR.RESOURCEPOOLID = VRP.PARENT_ID
WHERE  VCR.NAME = 'ESXi 910 SQL Cluster 5.0'

GROUP BY
   VPH.[NAME]
 , VPH.[DNS_NAME]
 , VPH.[ENABLED]
 , VPH.[VMOTION_ENABLED]
 , VPH.[HOST_VENDOR]
 , HOST_MODEL
 , CPU_MODEL
 , CPU_COUNT
 , CPU_CORE_COUNT
 , CPU_HZ
 , CPU_THREAD_COUNT
 , MEM_SIZE
 , VPH.[CPU_POWER_MGMT_POLICY]
 , VPH.[CPU_POWER_MGMT_SUPPORT]
 , VPH.[BOOT_TIME]
 , VPH.[PRODUCT_VERSION]
 , VPH.[PRODUCT_BUILD]
 , VPH.[IP_ADDRESS]
 , VPH.[NIC_COUNT]
 , VPH.[HBA_COUNT]

ORDER BY
 [PRODUCT_BUILD]
;


SQL Server Queries for Datastore Configuraion for ESXi Host
In some of the following T-SQL we will find out how Datastores are configured and allocated across ESXi hosts. We can find out information about the physical HBAs on the ESXi hosts: Fibre Channel, ISCSI, DAS, etc. We can also see what Datastores are on what ESXi hosts and use this to see how it works with the guest VMs on those Datastores, are they using the same Datastore and just how big are the Datastores. We can see a how the underlying Datastores (LUNS) are being accessed and how they are shared among our virtual SQL Servers by the ESXI hosts.
 USE VCDB;

SELECT
   VPH.[NAME]
 , VHB.[STATUS_VAL] AS [STATUS]
 --, VHB.[BUS_VAL]
 , VHB.[DRIVER_VAL] AS [DRIVER]
 --, VHB. [PCI_VAL]
 --, VHB.[KEY_VAL]
 , VHB.[DEVICE_VAL] AS [DEVICE]
 , VHB.[MODEL_VAL] AS [MODEL]
 --,[HOST_ID]
 , VHB.[VPX_TYPE]
FROM
 [VCDB].[dbo].[VPX_HOST_BUS_ADAPTER] AS VHB WITH (NOLOCK,NOWAIT)
  INNER JOIN [VCDB].[dbo].[VPXV_HOSTS] AS VPH WITH (NOLOCK,NOWAIT)
   ON
    VPH.HOSTID= VHB.[HOST_ID]
 LEFT OUTER JOIN [VCDB].[dbo].[VPXV_VMS] AS VPG WITH (NOLOCK,NOWAIT)
   ON
    VPH.HOSTID = VPG.HOSTID
  LEFT OUTER  JOIN  [VCDB].[dbo].[VPXV_RESOURCE_POOL] AS VRP WITH (NOLOCK,NOWAIT)
   ON
    VRP.RESOURCEPOOLID = VPG.RESOURCE_GROUP_ID
  LEFT OUTER JOIN  [VCDB].[dbo].[VPXV_COMPUTE_RESOURCE] AS VCR  WITH (NOLOCK,NOWAIT)
   ON
    VCR.RESOURCEPOOLID = VRP.PARENT_ID
WHERE
 VCR.NAME = 'ESXi 910 SQL Cluster 5.0'
 --AND VHB.[STATUS_VAL] = 'online'
GROUP BY
   VPH.NAME
 , VHB.[STATUS_VAL]
 --, VHB.[BUS_VAL]
 , VHB.[DRIVER_VAL]
 --, VHB. [PCI_VAL]
 --, VHB.[KEY_VAL]
 , VHB.[DEVICE_VAL]
 , VHB.[MODEL_VAL]
 --,[HOST_ID]
 , VHB.[VPX_TYPE]
;
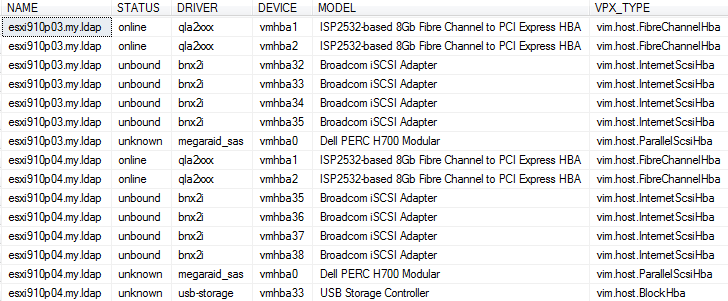
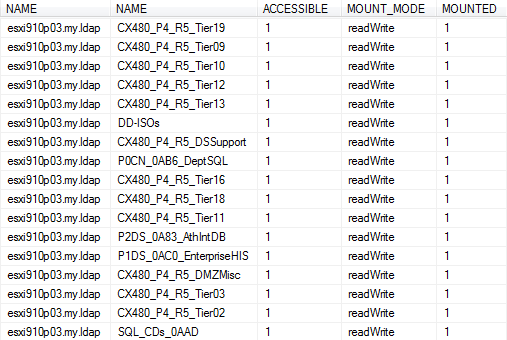
The query above returns the physical HBA information for all types of Disk/HBA devices and whether they are being used, online, available to be used if configured, unbound, or not available/unable to be used with storage, unknown. It also shows if there are redundant HBAs and what kind of storage is being used as well as the manufacturer of the HBA from the model. The query below will show the Datastores attached to the ESXi hosts which in a VMware cluster will show the same Datastores on the multiple hosts, a requirement for vMotion, HA and FT, and what you would expect. Shared DataStores should be on each ESXi host in the VMWare cluster and any Datastores that are not shared will cause issues if you use the VMWare features mentioned above. After the query a method to determine which Datastores are shared will be shown utilizing this query.
 USE VCDB;


SELECT
   --VHD.[HOST_ID]
   VPH.[NAME]
 --, VHD.[DS_ID]
 , VDS.[NAME] AS [DS_NAME]
 , VHD.[ACCESSIBLE]
 --, VHD.[MOUNT_PATH]
 --, VHD.[MOUNT_ID]
 , VHD.[MOUNT_MODE]
 , VHD.[MOUNTED]
FROM
 [VCDB].[dbo].[VPXV_HOST_DATASTORE] AS VHD WITH (NOLOCK,NOWAIT)
  INNER JOIN [VCDB].[dbo].[VPXV_DATASTORE] AS VDS WITH (NOLOCK,NOWAIT)
   ON VDS.ID = VHD.DS_ID
  INNER JOIN [VCDB].[dbo].[VPXV_HOSTS] AS VPH WITH (NOLOCK,NOWAIT)
   ON
    VPH.HOSTID= VHD.[HOST_ID]
WHERE
 VPH.NAME IN ('esxi910p03.my.ldap','esxi910p04.my.ldap', ... ,'esxi910p17.my.ldap')
;
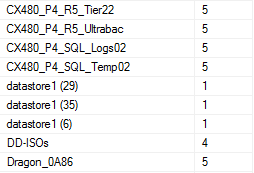
To check whether each Datastore is on each ESXi host this you can wrap the query above in a CTE and then use this snippet of code to check the count of each Datastore. As can be seen in the graphic there are several Datastores which are not on each ESXi host as the counts are not 5, this is not an issue for the DD-ISOs, CDs/DVDs used for installs, but the other three could be an issue if they need to be on more ESXi hosts.
USE VCDB;

WITH INFO_CTE
AS
(

..Put DataStore Query code above here ...

)
SELECT
 DS_NAME
 , COUNT(DS_NAME) AS DS_CNT
FROM
 INFO_CTE
GROUP BY
 DS_NAME
;
SQL Server Queries for Networking Configurations for ESXi Host
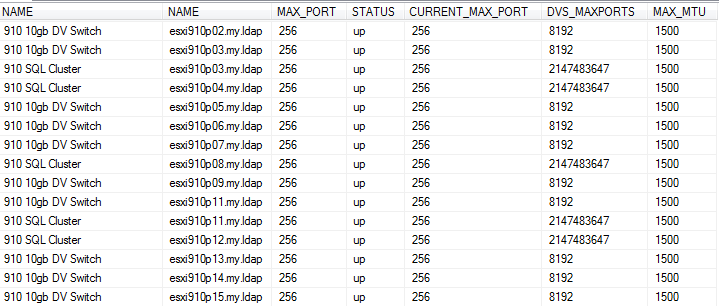
The final component we will cover is Networking in the VMWare environment and how to find the configurations for the ESXi hosts. As with other virtual environments the physical network is connected to logical software networks on the ESXi hosts, there are two types standard VMWare network switches and Distributed Network switches. The difference is that Standard Network switches are restricted/managed on a single ESXi host and Distributed Network switches are spread among multiple ESXi hosts allowing VM guests to be on the same distributed switch and managed centrally. The upshot of this is that to do vMotion, HA and FT with ease and better integration you have to use Distributed switches. If we can find out our configuration we can learn more about how our SQL Servers are going to perform, but to get this level of information we have to query the tables directly. So if you are at all concerned about this, use a restored copy of the database to get this information.
USE VCDB;

SELECT
   --VDVH.[DVS_ID]
   VDVS.NAME
 --, VDVH.[HOST_ID]
 , VPH.DNS_NAME
 , VDVH.[MAX_PORT]
 --, VDVH.[PRODUCT_NAME]
 --, VDVH.[PRODUCT_VENDOR]
 --, VDVH.[PRODUCT_VERSION]
 --, VDVH.[PRODUCT_BUILD]
 --, VDVH.[VSWITCH_KEY]
 , VDVH.[STATUS]
 --, VDVH.[STATUS_DETAIL]
 --, VDVH.[HAS_SHADOW_PORTS]
 , VDVH.[CURRENT_MAX_PORT]
 , VDVS.MAX_PORT AS DVS_MAXPORTS
 , VDVS.MAX_MTU
FROM
 [VCDB].[dbo].[VPX_DVHOST] AS VDVH WITH (NOLOCK,NOWAIT)
  INNER JOIN [VCDB].[dbo].[VPX_DVS] AS VDVS WITH (NOLOCK,NOWAIT)
  ON
   VDVS.ID = VDVH.DVS_ID
  INNER JOIN [VCDB].[dbo].[VPXV_HOSTS] AS VPH WITH (NOLOCK,NOWAIT)
   ON
    VPH.HOSTID = VDVH.[HOST_ID]
;
VMWare and SQL Server Performance Tuning Considerations
Some next steps we could take are to use this information and that from the prior tip to tell us when we see a performance issue what SQL Servers are sharing which LUN. We use a query like below to get the SQL Servers on that DataStore and using all the information we know about our ESXi hosts we look for issues on any of the ESXi hosts sharing that DataStore and any VM guests on those hosts accessing the DataStore. Of course you would want to involve your VMWare and SAN administrators to help you.
USE VCDB;

SELECT
 VMS.[NAME] AS VM_NAME
 ,VH.NAME AS [HOST_NAME]
 , DS.NAME
 ,((CONVERT(Bigint,DS.[CAPACITY]))/(1024*1024*1024)) as DataStoreCapacityGB
 ,((CONVERT(Bigint,DS.FREE_SPACE))/(1024*1024*1024)) as DataStoreFreeGB
FROM
 [VCDB].[dbo].[VPXV_VMS] AS VMS WITH (NOLOCK,NOWAIT)
  INNER JOIN [VCDB].[dbo].[VPXV_HOSTS] AS VH WITH (NOLOCK,NOWAIT)
   ON
    VMS.HOSTID = VH.HOSTID
  INNER JOIN [VCDB].[dbo].[VPXV_VM_DATASTORE] AS VD WITH (NOLOCK,NOWAIT)
   ON
    VD.VM_ID = VMS.VMID
  LEFT OUTER JOIN  [VCDB].[dbo].[VPX_DATASTORE] AS DS WITH (NOLOCK,NOWAIT)
   ON
    DS.ID = VD.DS_ID
WHERE
 DS.NAME Like '%SQL_Logs03_12e0%'
ORDER BY
 VMS.[NAME]
;

Next Steps
We have covered an initial look into VMware ESXi Hosts using the vCenter DB. There are many ways to use this data but be sure you talk to your VMWare and SAN administrators before you make any snap judgments. It is important that you have an understanding of the physical configuration of ESXi hosts it can help you better understand how and why you are seeing the performance in your environment. And always be sure to exercise caution, read-only with NOLOCK and NOWAIT since the DB is live and in use, and never write to the DB under any circumstances.
There are a lot of great resources out there. Take the time to learn about VMWare and the features it can provide you and realize that virtualization is here to stay so embrace it. In the links below there are documents from VMware describing the Views and other information on Power/Network configuration and HA/FT/DRS features.
- To see a document on VMware Database Views go here: Using Database Views
- Host Power Management in VMware vSphere® 5: Host Power Management in VMware vSphere® 5
- VMware® Distributed Power Management Concepts and Use: VMware® Distributed Power Management Concepts and Use
- vSphere Availability: vSphere Availability
- vSphere Distributed Switch Part 3 – Difference between Standard Switch and Distributed switch : Difference between Standard Switch and Distributed switch
- Overview of vNetwork Distributed Switch concepts (1010555) : Overview of vNetwork Distributed Switch concepts (1010555)
About the author
 Brian P ODwyer is a BI Analyst at Cook Children's Health Care System who knows both Infrastructure and SQL server
This author pledges the content of this article is based on professional experience and not AI generated.
View all my tips


