By: Tim Smith | Comments (1) | Related: > Functions User Defined UDF
Problem
One popular question I receive from either gamers or traders is how to measure a behavioral streak with SQL Server? In some cases, these clients may not be tracking their measurements in a compatible manner, so this will also address the question, how do I measure the overall change from one day to the next, then measure the streak.
Solution
Suppose that I want to measure how many seconds it takes for me to complete 150 pushups, whether the daily change is greater than the previous day, and what's the longest streak I've had where I increased performance, measured by fewer seconds.
DECLARE @pushup TABLE(
PushupDate DATE,
PushupSeconds SMALLINT
)
INSERT INTO @pushup
VALUES ('2015-03-01',364)
, ('2015-03-02',334)
, ('2015-03-03',331)
, ('2015-03-04',327)
, ('2015-03-05',326)
, ('2015-03-06',330)
, ('2015-03-07',320)
, ('2015-03-08',301)
, ('2015-03-09',294)
, ('2015-03-10',299)
, ('2015-03-11',304)
, ('2015-03-12',306)
, ('2015-03-13',270)
, ('2015-03-14',268)
, ('2015-03-15',260)
, ('2015-03-16',265)
, ('2015-03-17',268)
, ('2015-03-18',250)
, ('2015-03-19',248)
;WITH MeasureChange AS(
SELECT ROW_NUMBER() OVER (ORDER BY PushupDate ASC) ID
, *
FROM @pushup
)
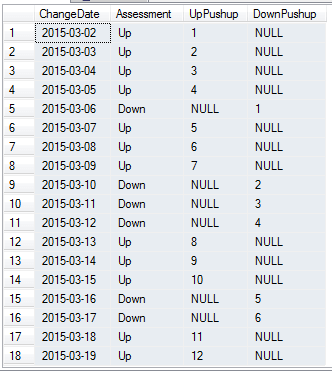
SELECT tt.PushupDate ChangeDate
, CASE
WHEN (tt.PushupSeconds - t.PushupSeconds) < 0 THEN 'Up'
ELSE 'Down'
END AS Assessment
INTO ##StreakTable
FROM MeasureChange t
INNER JOIN MeasureChange tt ON t.ID = (tt.ID - 1)In our first step, we measure whether we improved or not by looking at decreases in seconds as an Up measure (good) and no change or increases in seconds as a Down measure. We'll use these same measurements in a second to look at streaks. For now, we're using the ROW_NUMBER() function to order our rows by ascending dates to provide us with an ID to self-join to this common table expression; this is a fairly straight forward measuring change technique and I use it frequently (for instance, in this tip, I use it to measure the change of database size). As a quick note, I prefer to use ROW_NUMBER() in most cases because it converts problems into mathematical operations, which makes more sense as a product of Saxxon Math, as well as works in more editions of SQL Server; some developers will prefer to use the new LAG and LEAD functions, available in 2012 and later versions. Always use what makes sense, functions correctly, and performs faster.
Finally, we insert the data into a temporary table, as some developers' challenge is in calculating the streak (they already have the data ordered, such as win-loss-tie). Now, if we look at our data, we notice that the longest streak I experienced in doing 150 pushups in a shorter time period was between March 2nd and March 5th; this is easy to see when the data set is small; what about when we have thousands of records?
Like removing duplicates, using a common table expression, we'll be using PARTITION BY and this seems to cause quite a bit of confusion when I talk to developers about using it ("I don't understand what it does"). Let's use a simple example of PARTITION BY to see it in action, using securities and types:
DECLARE @CUSIP TABLE(
	FinancialSecurity VARCHAR(10),
	SecurityType VARCHAR(100)
)

INSERT INTO @CUSIP
VALUES ('ODMAX','Mutual Fund')
	, ('SPY','ETF')
	, ('DDS','Stock')
	, ('30YT','Bond')
	, ('10YT','Bond')
	, ('VAIPX','Mutual Fund')
	, ('2801','ETF')
	, ('LUKOY','Stock')
	, ('Gold','Commodity')
	, ('Cotton','Commodity')

SELECT ROW_NUMBER() OVER (PARTITION BY SecurityType ORDER BY FinancialSecurity ASC) SecurityOrder
	, *
FROM @CUSIP
In the above example, PARTITION BY is dividing by SecurityType, and we see that we have five security types: bonds, commodities, ETFs, mutual funds, and stocks. ROW_NUMBER() simply orders after the division and does so alphabetically, notice how Cotton comes before Gold; it's like if I gave you a basket of fruits, vegetables, and minerals, and you divided the basket of items by the type then ordered each item alphabetically; the above code is performing the same. This is why PARTITION BY and ROW_NUMBER() are useful in removing duplicates because it's dividing by different rows of data, then ordering the same rows by number. It's a simple matter of removing anything greater than one. From a mathematical standpoint, think of PARTITION BY as a division operation. Therefore, we can use PARTITION BY when looking at streaks because our streaks will be of a certain type, in our case Up or Down.
Let's use PARTITION BY and order our rows by assessment with our temporary table, Streak:
SELECT *
	, CASE
		WHEN Assessment = 'Up' THEN ROW_NUMBER() OVER (PARTITION BY Assessment ORDER BY ChangeDate ASC)
		ELSE NULL
	END AS UpPushupOrder
	, CASE
		WHEN Assessment = 'Down' THEN ROW_NUMBER() OVER (PARTITION BY Assessment ORDER BY ChangeDate ASC)
	ELSE NULL
	END AS DownPushupOrder
FROM ##StreakTable
ORDER BY ChangeDate ASC
We now have the assessments Up or Down ordered. Because we want to look for the maximum Up streak, we'll leave out the Down, though it's useful to see the output at this time using PARTITION BY. From here, we have a few possibilities: we can look at what the former row is, if there's a NULL value, demarcate the next set of rows in a streak or we can use Itzik Ben-Gan's approach (Inside Microsoft SQL Server 2008: T-SQL Querying, Pages 380-381; 5 star recommended) by looking at differences. The latter tends to be better for performance, as well as makes more sense mathematically, since we're using differences. Let's notice how the ChangeDate's are ordered one day at a time with UpPushUpOrder, yet skip a day when we arrive at the next set of UpPushUpOrder streak(s); for instance, March 5th is the 4th day in a row (difference of 1), and March 7th is the 5th day (difference of 2) - but not in a streak, it's the start of a new streak. The trouble here is that if we used the difference with day of the month, it would be reset every month and similarly is true if we used the day of the year. On the other hand, we can use ROW_NUMBER() over our date and now we have an increasing row order, which will take account of difference.
SELECT *
	, ROW_NUMBER() OVER (ORDER BY ChangeDate ASC) RowNumberOrder
	, CASE
		WHEN Assessment = 'Up' THEN ROW_NUMBER() OVER (PARTITION BY Assessment ORDER BY ChangeDate ASC)
		ELSE NULL
	END AS UpPushupOrder
	, CASE
		WHEN Assessment = 'Up' THEN (ROW_NUMBER() OVER (ORDER BY ChangeDate ASC) - ROW_NUMBER() OVER (PARTITION BY Assessment ORDER BY ChangeDate ASC))
		ELSE NULL
	END AS TwoRowDifference
FROM ##StreakTable
ORDER BY ChangeDate ASC
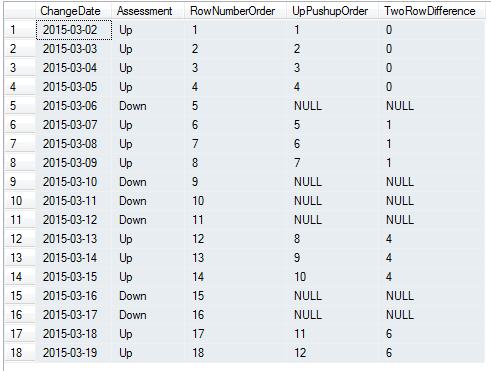
Seeing this output, we know that we can divide using PARTITION BY by the different numeric categories (just like we did with mutual funds, stocks, bonds, etc.):
;WITH UpStreak AS(
	SELECT *
		, ROW_NUMBER() OVER (ORDER BY ChangeDate ASC) RowNumberOrder
		, CASE
			WHEN Assessment = 'Up' THEN ROW_NUMBER() OVER (PARTITION BY Assessment ORDER BY ChangeDate ASC)
			ELSE NULL
		END AS UpPushupOrder
		, CASE
			WHEN Assessment = 'Up' THEN (ROW_NUMBER() OVER (ORDER BY ChangeDate ASC) - ROW_NUMBER() OVER (PARTITION BY Assessment ORDER BY ChangeDate ASC))
			ELSE NULL
		END AS TwoRowDifference
	FROM ##StreakTable
)
SELECT ChangeDate
	, Assessment
	, CASE
		WHEN Assessment = 'Up' THEN ROW_NUMBER() OVER (PARTITION BY TwoRowDifference ORDER BY ChangeDate)
		ELSE NULL
	END AS Streak
FROM UpStreak
ORDER BY ChangeDate
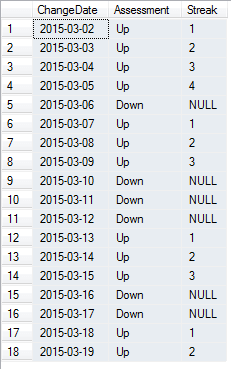
Now that we have our output, depending on what we want, such as the longest streak, current streak, average length of strength, etc., are easily obtainable.
Why can streaks be helpful to measure? When I was young and raised chickens on my farm, I observed, using streaks, that Leghorn and Araucana chickens laid eggs with more consistent frequency versus the New Jersey Giants and Rhode Island Reds. In addition, they consumed less food. From a ROI standpoint, I allowed the former two to become mothers and raise chicks instead of allow the latter two, increasing egg output over five years (as well as increasing barter leverage with neighbors). Another streak I noticed in college, while working as a financial advisor, was how people who were predictable made better borrowers than people who were spontaneous (Scott Adams' boss agreed); passion seldom led to action, whereas the person who consistently did something, would go on to succeed. Don't underestimate this valuable measure; if you can mathematically identify it, you may spot a pattern many others miss because it's neither bright nor shiny - it's predictable and that is exactly the point.
Next Steps
- If your data aren't measured appropriately to calculate a streak, do so first to make the step of finding streaks easier.
- If your items are ordered, use the above to calculate streaks with your data.


About the author
 Tim Smith works as a DBA and developer and also teaches Automating ETL on Udemy.
This author pledges the content of this article is based on professional experience and not AI generated.
View all my tips
