By: Junaith Haja | Comments (1) | Related: > Integration Services Performance
Problem
In most companies developers are restricted from accessing the MSDB database and they rarely know the performance of their packages in a production environment unless they have access to third party software tools or a friendly DBA. This happened to me once when I wanted to know how long my packages ran in a production environment and I had no access to the MSDB database to look at the sysjobs and sysschedules tables. The work around is to enable SQL Server logging in SSIS packages and to create a SSRS report from the sysssislog table.
Solution
The logic behind this solution is to enable SQL Server Logging in SSIS packages while we create/develop the package and send it for deployment.
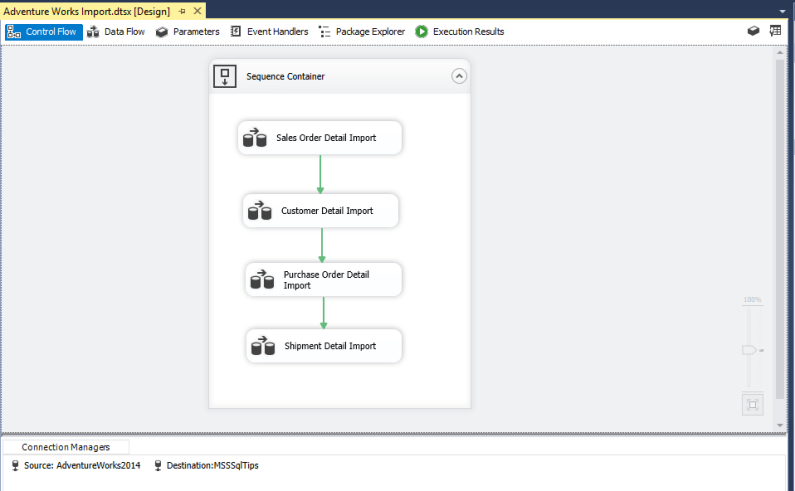
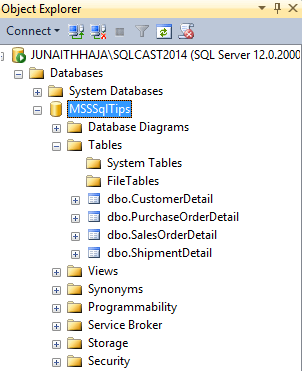
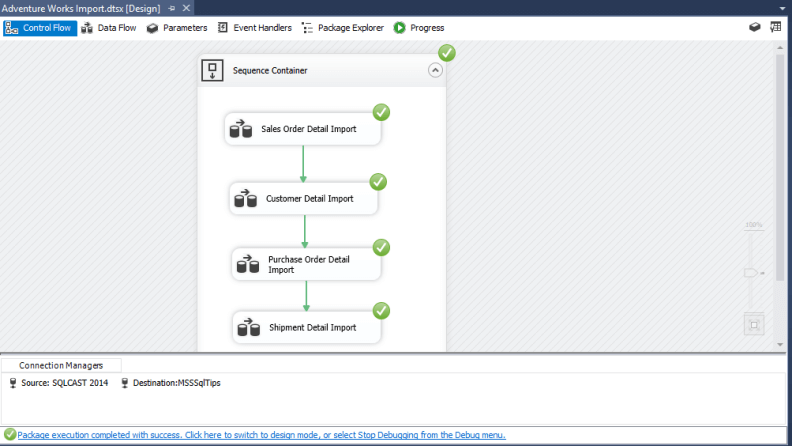
For this demo open any of your existing packages. I opened my Adventure Works import package which imports Sales, Customer details, Purchase Orders and Shipment details from my SQLCAST 2014 source database to my MSSQLTips destination database. In this example, both databases are on different servers.
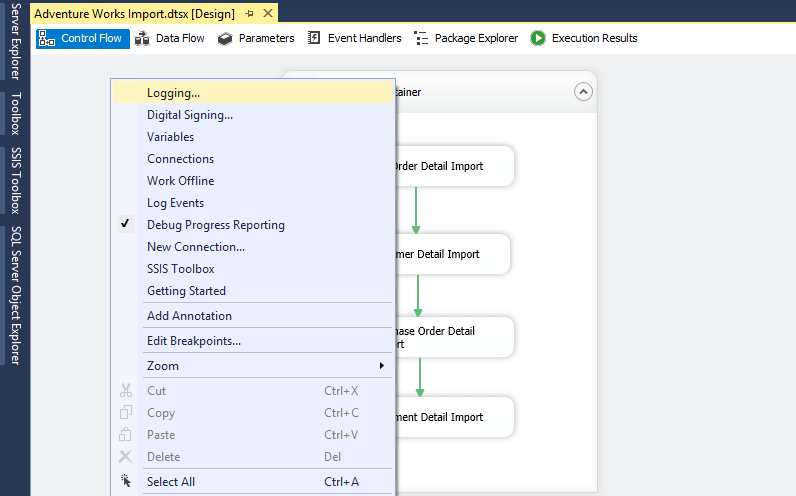
Next step is to enable Logging in the package by right clicking in the Designer and select Logging as shown below.
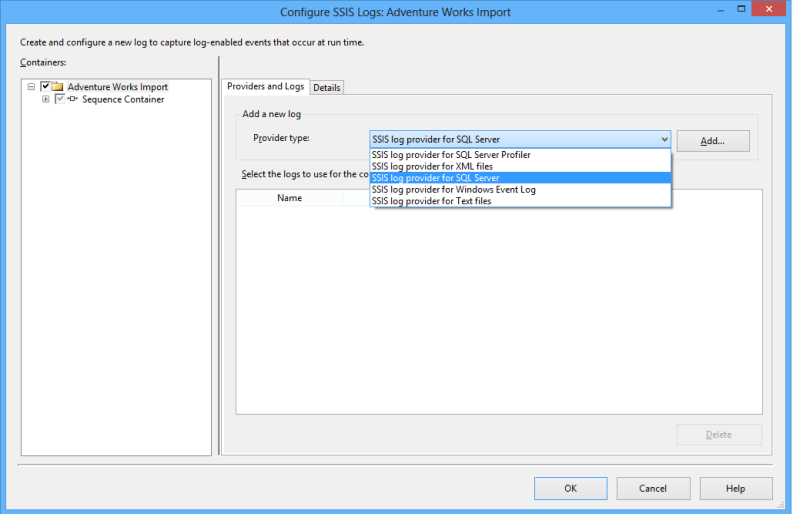
Select "SSIS log provider for SQL Server" from the options provided and click Add.
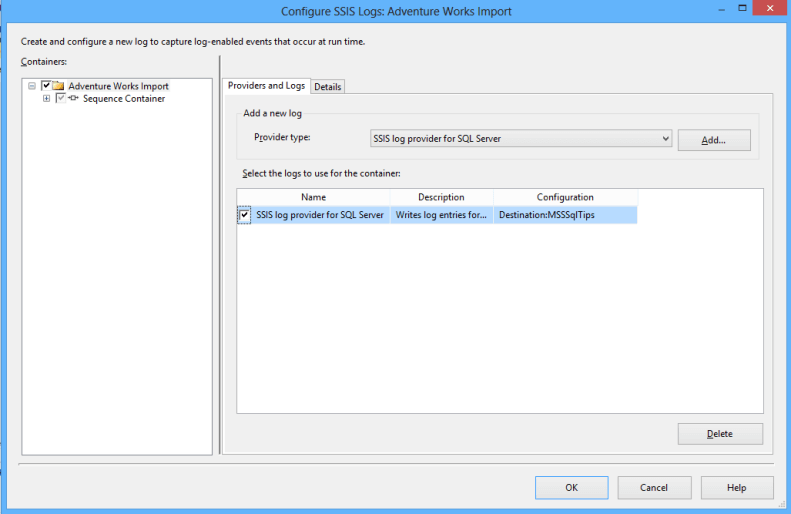
In the configuration drop down, select the connection manager of the destination MSSQLTips database.
When SQL Server Logging is enabled in a package, it creates a sysssislog table in the database during its first run and logs all the package related events in that table.
Here is the destination MSSQLTips database view from SQL Server Management Studio Object Explorer and we see there is not a table with the name syssislog before the package execution.
Let's run the package by right clicking in the package and click Execute Package. The package runs and completes as shown below.
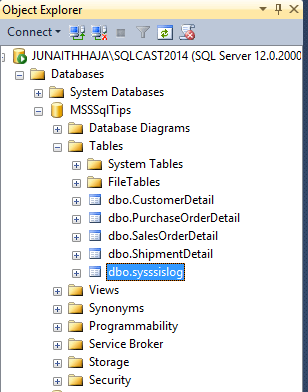
Let's refresh the destination MSSQLTips database and we will have a new table sysssislog as shown below.
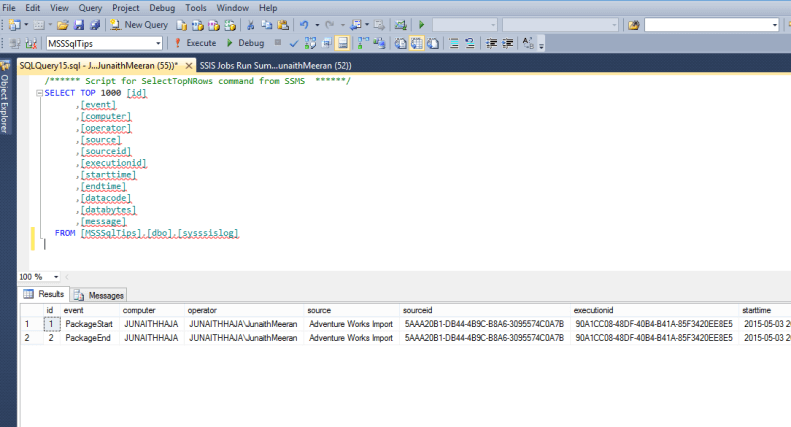
Open the sysssislog table and you will see the data like below.
Create SSRS Report
The below code is used to calculate the time taken for the package to run from the above table.
SELECT  COMPUTER as MACHINE_NAME
       ,OPERATOR AS LOGIN_NAME
	   ,SOURCE AS PACKAGE_NAME
	   ,MAX(DATACODE) AS DATA_CODE
	   ,MIN(STARTTIME) AS START_TIME
	   ,MAX(ENDTIME) AS END_TIME
	   ,DATEDIFF(MINUTE,MIN(STARTTIME),MAX(ENDTIME)) AS RUN_TIME

FROM    SYSSSISLOG
WHERE        (EVENT IN ('PACKAGESTART', 'PACKAGEEND'))
GROUP BY COMPUTER, OPERATOR, SOURCE
ORDER BY SOURCE
GO
We will use the above code to create a SSRS report using these indicators.
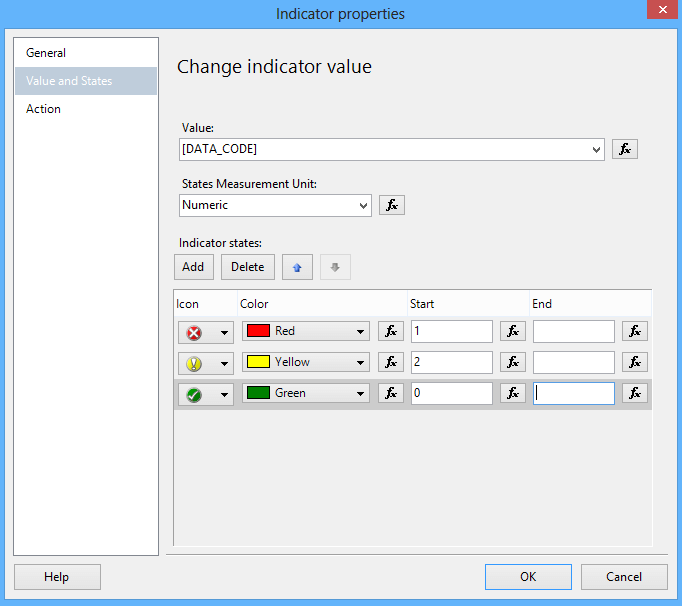
According to MSDN specifications, the values returned in the datacode column of the sysssislog table gives the result of a package run and they are as follows. We will use these as indicators for the SSRS report.
- Datacode = 0 represents Success
- Datacode = 1 represents Failure
- Datacode = 2 represents Cancelled
Create a new SSRS Report project and add a new Report Item and add connection to the MSSQLTips database at the data source.
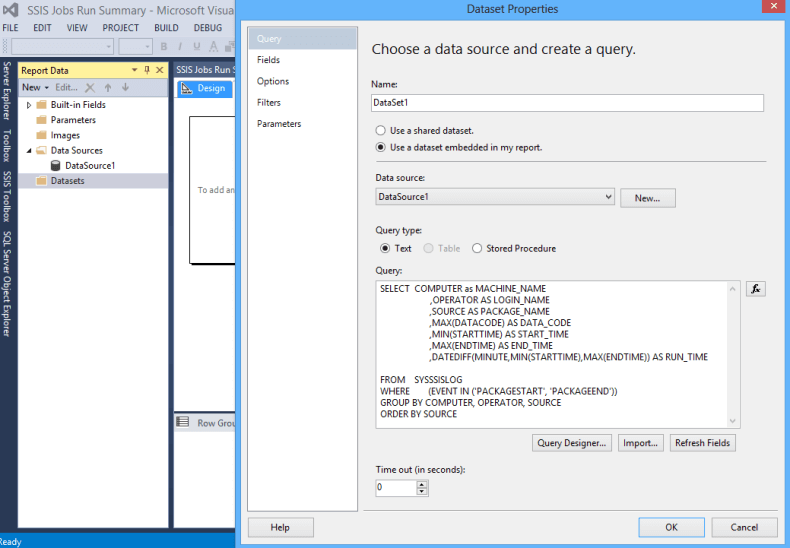
Add a new dataset and select use the dataset embedded in my report option and connect to the data source created.
Copy and paste the above SQL query in the Query box of the dataset properties section as shown below:
Go to the toolbox then drag and drop a table. Next map it to the columns of the dataset and keep the datacode column as the last column and rename the column header to Result.
Drag and drop the indicator from the toolbox to the DataCode column, it will open a box like below:
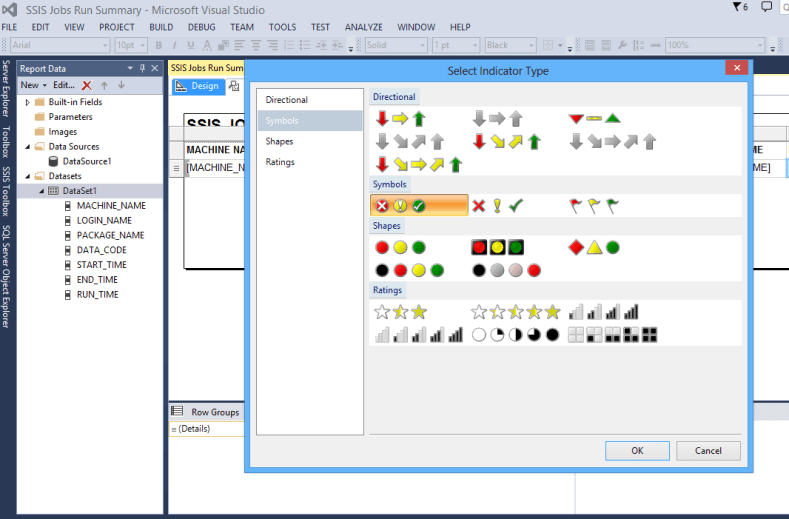
Select the above symbol and click OK.
Right click the datacode column and open the Indicator Properties. Next go to the Values and States tab then map the values of the data code as shown below and press the OK button.
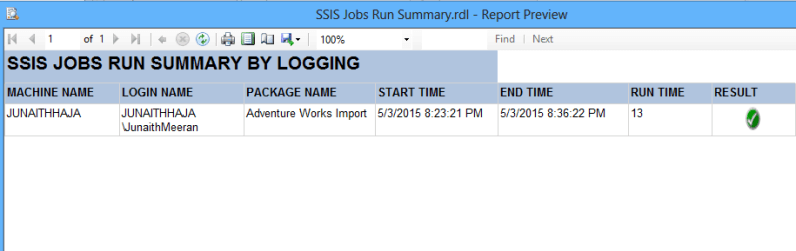
The indicator column changes like below. Format the column headers as per your convenience and the report looks like the below example in the designer:
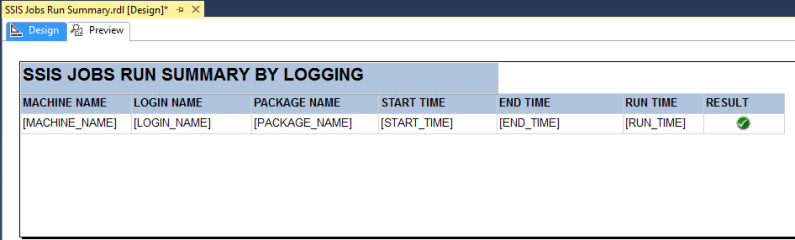
Run the report by right clicking at the Report Item level in the solution properties and you will see the report run as shown below.
Next Steps
Extend the above logging process for all your packages and try creating the report to show a summary of all packages.
Check out more tips related to SSIS:
- Integration Services Performance Tips
- Integration Services Development Tips
- All SQL Server Business Intelligence Tips


About the author
 Junaith Haja is a Senior Business Intelligence Consultant with Browse Info Solutions, Inc and leads a Microsoft SQL Server and BI team.
 This author pledges the content of this article is based on professional experience and not AI generated.
View all my tips
