By: Greg Robidoux | Comments (7) | Related: 1 | 2 | 3 | > Monitoring
Problem
Keeping track of your transaction log usage is key to understanding how your database transaction logs are being used as well as keeping track of how much space the transaction logs are using. Depending on the recovery model that is set within your database and also the backup jobs that you run, the size of your transaction log can vary quite a bit. So what is the best way to keep track of the transaction log usage?
Solution
SQL Server has a command that you can run to see the current size of the transaction logs and how much space is currently being utilized. The command is DBCC SQLPERF(logspace). This is a very simple command to run and interpret and this is key to getting an understanding of how your transaction logs are being used.
Here is sample output after running the command.
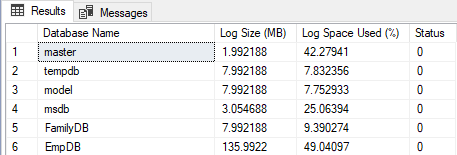
As you can see there are only four columns. Below is a description of each of these.
- Database Name - Name of the database for the log statistics displayed.
- Log Size (MB) - Actual amount of space available for the log.
- Log Space Used (%) - Percentage of the log file currently occupied with transaction log information.
- Status - Status of the log file. Always 0.
If you run this command at different times you will see the Log Space Used (%) increase and decrease depending on the activity in your database, the recovery model that you have set and also whether you are running transaction log backups. Also, if your transaction logs are set to auto grow and/or auto shrink you will see the size of the file either increase or decrease again depending on activity.
To gain some further insight it would be helpful to capture this data at a set time and then go back and analyze the data at a later time. This can be done by sending the output of this command to a table.
Below is a simple way of beginning this process. There are three pieces of code here:
- Stored Procedure spSQLPerf - the only purpose of this command is to be able to send the output from the DBCC command into a temporary table
- Table logSpaceStats - this will store the long term stats data
- Stored Procedure spGetSQLPerfStats - this calls spSQLPerf and inserts the data into table logSpaceStats
CREATE PROC dbo.spSQLPerf
AS
DBCC SQLPERF(logspace)
GO

CREATE TABLE dbo.logSpaceStats
(
   id INT IDENTITY (1,1),
   logDate datetime DEFAULT GETDATE(),
   databaseName sysname,
   logSize decimal(18,5),
   logUsed decimal(18,5)
)
GO

CREATE PROC dbo.spGetSQLPerfStats
AS
SET NOCOUNT ON

CREATE TABLE #tFileList
(
   databaseName sysname,
   logSize decimal(18,5),
   logUsed decimal(18,5),
   status INT
)

INSERT INTO #tFileList
       EXEC spSQLPerf

INSERT INTO logSpaceStats (databaseName, logSize, logUsed)
SELECT databasename, logSize, logUsed
FROM #tFileList

DROP TABLE #tFileList
GO
After you have created the above components you need to call the procedure as follows to capture the information. This can be done manually or you can setup a scheduled job to have this run every hour or some other set schedule.
EXEC dbo.spGetSQLPerfStats
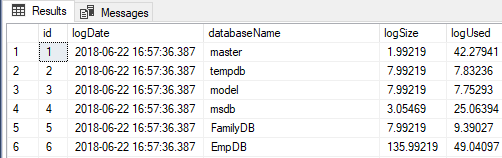
To take a look at the results just query the logSpaceStats table. This can be done across the board or for an individual database.
SELECT * FROM dbo.logSpaceStats
Here is what the data in the table looks like. We can see we have a log date column along with the data.
Next Steps
- This is just one component of monitoring your server and your transaction log usage.
- Review this data to see how space usage is being used as well as a guideline to size your transaction logs appropriately
- After large transactions run these commands to see how much transaction log space is being used.


About the author
 Greg Robidoux is the President and founder of Edgewood Solutions, a technology services company delivering services and solutions for Microsoft SQL Server. He is also one of the co-founders of MSSQLTips.com. Greg has been working with SQL Server since 1999, has authored numerous database-related articles, and delivered several presentations related to SQL Server. Before SQL Server, he worked on many data platforms such as DB2, Oracle, Sybase, and Informix.
This author pledges the content of this article is based on professional experience and not AI generated.
View all my tips
