By: Tim Cullen | Comments (3) | Related: > Performance Tuning
Problem
If you're like any other DBA or developer in the world, writing sound T-SQL code and performance tuning is one of your primary duties. There are many tools, both native to SQL Server and third-party, that assist you in this endeavor. But in thinking about writing and tuning queries, what should the focus be? For many, the length of time taken to execute the query is "good enough". One focus should be on the resources used by the server, since the length of time taken to execute the query can vary based on other server activity. In addition to using Profiler and Execution Plans, consider using SET STATISTICS IO and SET STATISTICS TIME.
Solution
SET STATISTICS IO and SET STATISTICS TIME are two settings that can help you measure the absolute resources needed by a server during query execution. SET STATISTICS IO displays statistics on the amount of disk activity generated by the query. SET STATISTICS TIME displays the amount of time needed to parse, compile, and execute each statement in the query. By writing a query a few different ways you can compare the statistics and determine the best statement to deploy to production.
Turning these settings on can be done one of two ways. First this can be done by using the SET commands to turn on and off these options or you can turn these options on and off by using the option settings in Query Analyzer.
Before you run the commands you need to turn on these settings and then issue your SQL statements. In addition, once these are turned on you will get these statistics for all queries for the current session you are working in until you have turned these settings off.
SET STATISTICS IO
Here is an example of turning the STATISTICS IO on and off.
-- turn on statistics IO
SET STATISTICS IO ON
GO -- your query goes here
SELECT * FROM Employee
GO
-- turn off statistics IO
SET STATISTICS IO OFF
GO
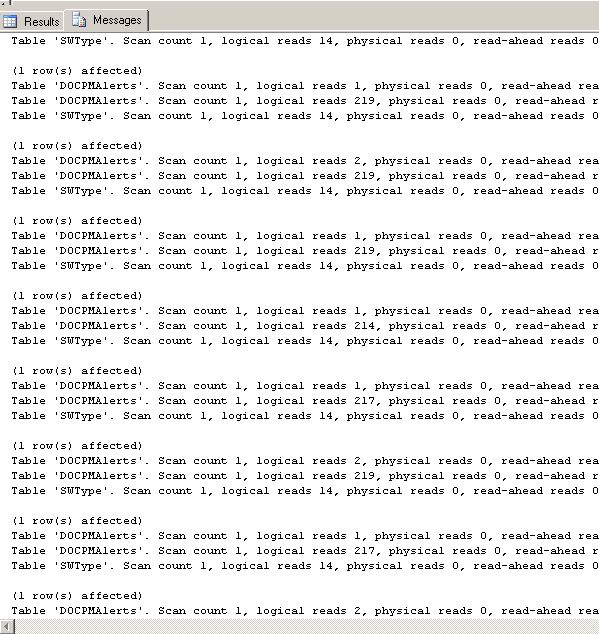
Here is an example of the output with SET STATISTICS IO turned on (the query statement evaluated is a cursor). From this we can see that there are several iterations for each time the cursor loops through the data. Each of these shows how many pages are accessed for each process that SQL Server executes.
SET STATISTICS TIME
Here is an example of turning the STATISTICS TIME on and off.
-- turn on statistics IO
SET STATISTICS TIME ON
GO -- your query goes here
SELECT * FROM Employee
GO
-- turn off statistics IO
SET STATISTICS TIME OFF
GO
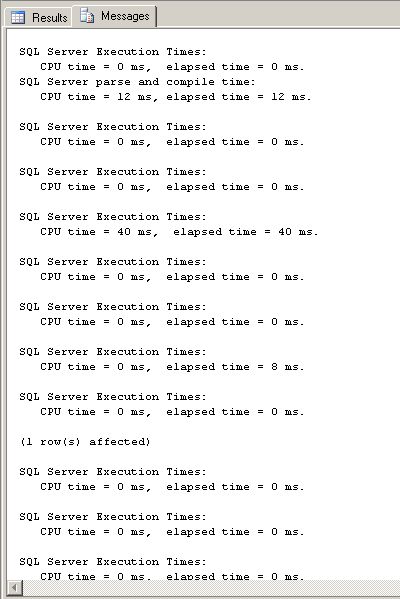
Here is an example of the output with SET STATISTICS TIME turned on. This output shows the time in milliseconds for each operation to complete. These times could vary depending on when this is run, the load on the system as well as the size of the data set.
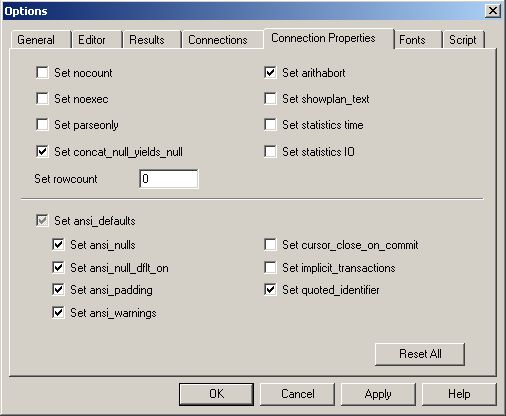
SET STATISTICS IO and STATISTICS TIME from SSMS Options
To set the STATISTICS IO and STATISTICS TIME options inside Query Analyzer, click Tools -> Options -> Connection Properties and then check either or both "Set statistics time" or "Set statistics IO".
There you have it. Two more additional pieces of information that can be used to determine how your queries are executing. The data you get from the execution plan is helpful, but these additional pieces of information provide additional insight as to how your queries are performing.
Next Steps
- When testing or tuning queries, use the SET STATISTICS IO and TIME options to shed more light on what server resources are being used
- Read more information about setting STATISTICS IO options in SQL Server
- Read more information about setting STATISTICS TIME options in SQL Server
- Read information on Analyzing a Query in SQL Server
- Find more great tips on Query Optimization and Performance Tuning


About the author
 Tim Cullen has been working in the IT industry since 2003 and currently works as a SQL Server Reports Developer.
This author pledges the content of this article is based on professional experience and not AI generated.
View all my tips
