By: Kun Lee | Comments (5) | Related: > Performance Tuning
Problem
Very often when performance problems arise there are a few tools that I always first look at using to help troubleshoot SQL Server issues. One of these tools is Performance Monitor. This tool is usually run interactively and only for a short duration which does not give you a full picture of what is going on with your server. In addition, it is often the case that when you needed to collect the information the time has already passed and therefore the opportunity is gone. How can we setup Performance Monitor to collect data all of the time, so we can go back and review the data when needed?
Solution
Performance Monitor (perfmon) is a powerful tool that comes with all Microsoft operating systems. There are many other third party tools, but why not use the Performance Monitor tool which is included for free with your operating system? There are many different ways to configure and use this tool, but I would like to share the method that I have been using and it how it has worked for me.
One thing to remember is that there is not exact threshold for a lot of the counters to determine if there is an issue or not your server, so it is very important to collect performance counter data while the server is running healthy, so you can give yourself a baseline to measure against.
Start Perfmon
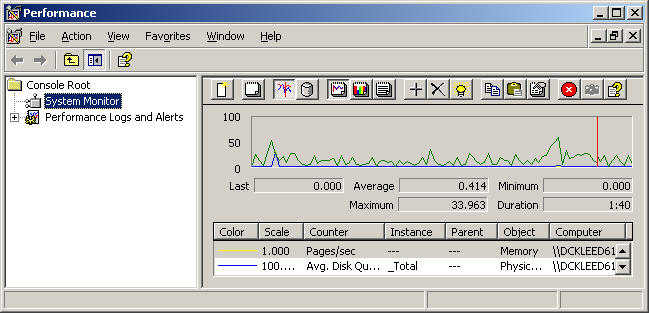
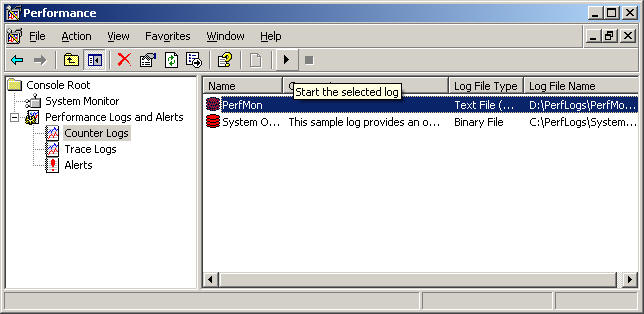
There are many ways to start perfmon and here are a few methods. One of my favorite is "Click Start, click Run, and then type perfmon.msc or perfmon in the Open box" . When it starts you will get a screen like the following.
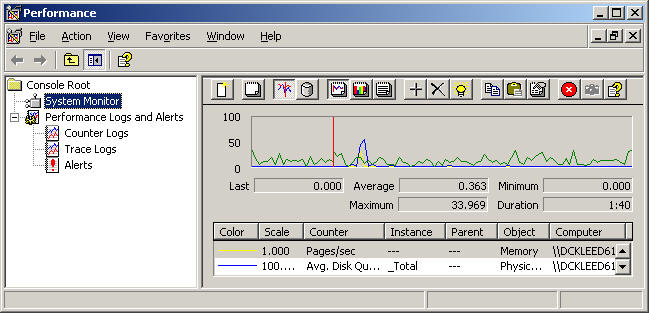
Click the plus sign next to "Performance Logs and Alerts" to expand.
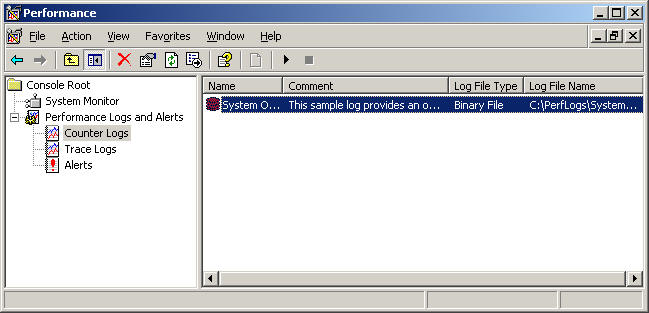
Click "Counter Logs"
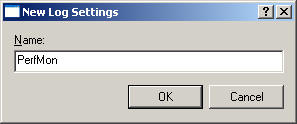
On the menu select Action -> New Log Settings and enter a name that makes sense to you. I usually put either the server name or a generic name like "PerfMon". If you store these files in a central place for several servers, it helps to use the server name as the filename. For this example, I am just using a generic name and clicking "OK".
Now it will open a new window as below.
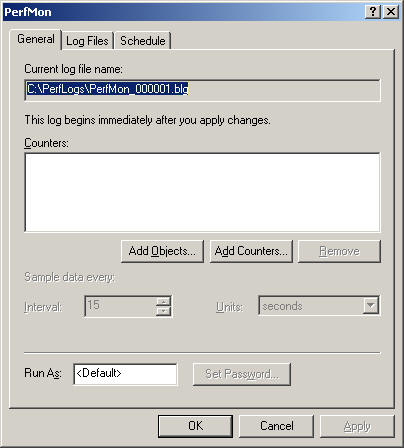
Setup PerfMon: There are three areas that you have to setup.
-
Counters to monitor: what are the areas that you want to monitor
-
Log file type: format for storing the data
-
Schedule: how often you want to track and store the collected data
Setting up counters to monitor
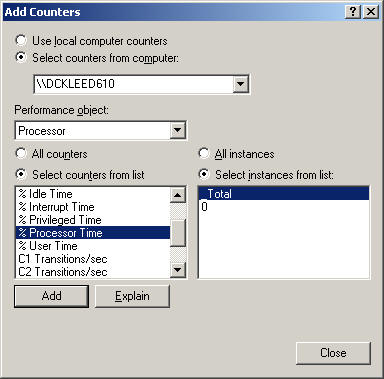
Let's add some counters. Click "Add Counters..." to choose individual counters or if you wish you can choose "Add Objects...". One thing to note is that if you select "Add Objects..." you may add counters that you never need and it will not only waste storage, but also resources from the system, so I don't recommend it.
So, let's choose three counters for our example.
Counter 1:
Performance objects: Processor
Select counters from list: % Processor Time
Choose Select instance from list: _Total
Counter 2:
Performance objects: Memory
Select counters from list: Pages/sec
Choose Select instance from list: empty
Counter 3:
Performance objects: PhysicalDisk
Select counters from list: Avg. Disk Queue Length
Choose: All instances
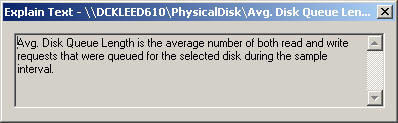
If you are not sure what information the counter will give you, you can click "Explain", it will open another window and offer an explanation of the counter that you chose. Here is the example of Counter 3, Avg Disk Queue Length.
Once you are done, your screen should like like the below screenshot.
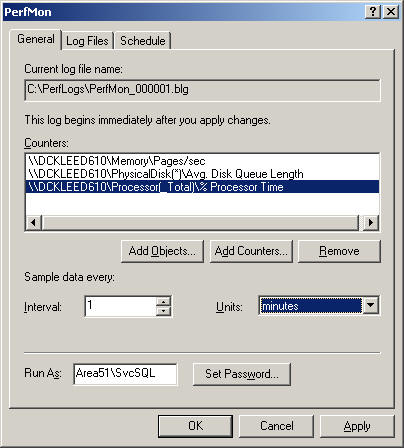
For production servers, obviously you don't want to collect data every 15 seconds which may put too much pressure on your server and also waste storage as well. Depending on what you do, you may want to choose to collect every 1 min to every 15min. I do not recommend setting longer then 10 min though, because that may not capture enough information to troubleshoot an issue. I will choose every 1 minute for this example.
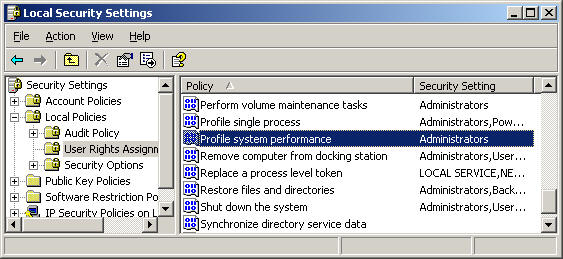
Now, if you are collecting to the server locally, you do not need to set "Run As:" but if you are collecting data from a remote server, then you need to set the service account, which has proper permissions to collect the data.. The service account needs to have at least "Profiler system performance" rights from Local Security Settings. For more information, you can read this article: http://www.microsoft.com/technet/prodtechnol/windows2000serv/reskit/gp/551.mspx?mfr=true
Setting "Log Files" type.
This will decide how the data will be stored once it is collected. For this example I chose "Text file (Comma delimited)" and chose "End file names with: yyyymmdd"
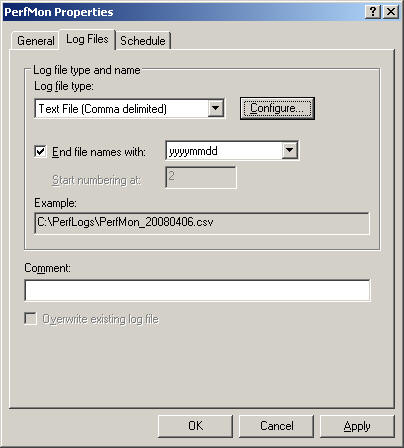
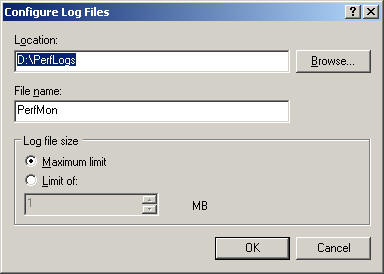
And then choose "Configure".
Tip> I strongly recommend changing "Locations" to a drive other than the C drive. I see this often where people set this up and then run out of space on the C drive which then impacts the O/S.
Schedule
This is how I usually setup my schedules.
Start Log At: 12:00:00 AM on FOLLOWING DAY and Stop Log After 1 days and choose "Start a new log file"
Here is the example, assume I set this up on 5/1/2008, here is the example how it will look like.
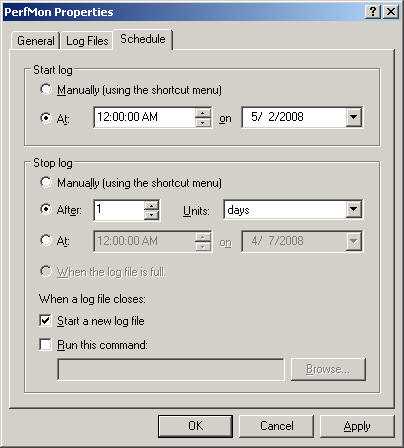
This will create one file each day with a filename like "D:\PerfLogs\PerfMon_20080502.csv".
Click "OK" to finish this step.
Tip> Before you setup the schedule, you can first run it manually by clicking this icon ![]() . This will let you make sure you are collecting the correct data before scheduling it to run.
. This will let you make sure you are collecting the correct data before scheduling it to run.
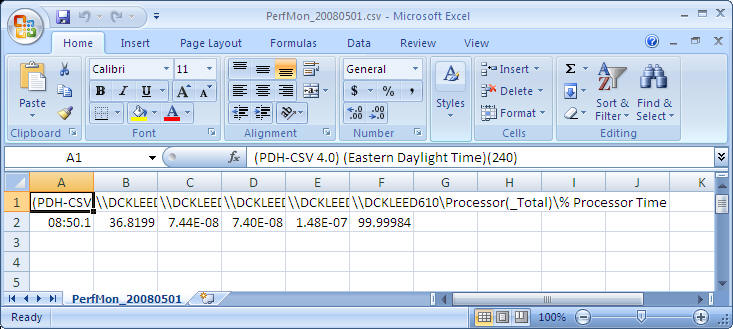
For the test, check to make sure it created the file correctly.
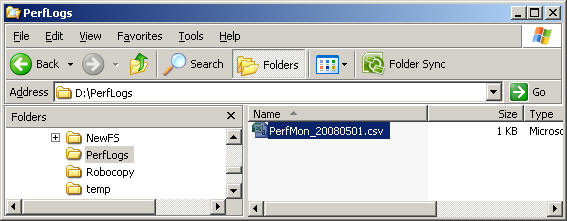
To look at the data using Excel, just double click on the CSV file that was created to see if you are collecting the counters correctly.
Tip> Once you are done testing, go back to the "Schedule" section and reset the schedule correctly once again especially "start a new file" section.
Tip> Also setup a script to delete old files, so you don't run out of space on your file system.
Next Steps
- This is the first step in collecting this information. Once you have this data collected it makes it a lot easier to troubleshoot issues in the future.
- Now that you have setup Perfmon, you need to know how to read the counters, so look for future tips on how to use Perfmon data


About the author
 Kun Lee is a database administrator and his areas of interest are database administration, architecture, data modeling and development.
This author pledges the content of this article is based on professional experience and not AI generated.
View all my tips
