By: Sankar Reddy | Comments (2) | Related: More > System Databases
Problem
We are using SQL Server 2008 and the server has a lot of performance issues that seem to be related to a saturated tempdb database. TempDB on this server is heavily used by creating and dropping many temp tables and work tables. How do I effectively find out if the Tempdb database is suffering from an allocation bottleneck? Should I create multiple TempDB files per core on this server to improve performance? How do I check this information programmatically?
Solution
TempDB is an important part of SQL Server when an application creates many work and temporary tables. As such, Tempdb should be monitored for performance issues. Tempdb can be a severe bottleneck on the server if not properly configured and optimized. One of the potential problems with Tempdb is that it can be allocation bottleneck. This allocation bottleneck happens when you have a workload that creates and drops many temp tables from concurrent connections, utilizes heavy workload of worktables that are created by using extensive use of group by, order by, distinct, logic with a large set of data.
What is allocation bottleneck?
In short, SQL Server uses PFS (Page Free Space), GAM (Global Allocation Map) and SGAM (Shared Global Allocation Map) pages for allocating and deallocating space by placing SH (shared) and UPDATE latches on these pages. When multiple CPU's with concurrent connections, create and drop temp tables, work tables, the allocation bottleneck comes into play when these connections need to take latches on PFS, GAM, SGAM pages in conflicting modes. This allocation algorithm is explained in detail by Sunil Agarwal in this post. TempDB is prone to this allocation bottleneck and when this happens it can affect the overall performance of the whole server since TempDB is responsible for temporary objects for the entire instance.
How is TempDB allocation tracked in SQL Server 2005?
SQL Server 2005 has exposed a lot of information in the catalog views. Specifically the sys.dm_os_waiting_tasks view is used to track the allocation bottlenecks. Here is the code snippet to review that data.
--Look for PFS and GAM pages '2:1:1' and '2:1:3'
--'2:1:1'/'2:1:3' is really 2: tempdb, 1: file number, 1: PFS, 3: GAM
SELECT
   session_id
   , wait_duration_ms
   , resource_description
FROM sys.dm_os_waiting_tasks
WHERE wait_type LIKE 'PAGE%LATCH_%' AND Resource_description LIKE '2.%'
Note that the above catalog view returns information about the tasks that are currently waiting on some resources. In other words, the information returned by sys.dm_os_waiting_tasks is transient and has to read at the exact moment. So, the above query has to be constantly polled at regular intervals to get a glimpse of allocation bottleneck. Our chances of capturing an allocation bottleneck correctly depends on the polling the table and there are ample chances of not being able to capture completely.
Monitoring TempDB allocation using Extended Events in SQL Server 2008
SQL Server 2005 allows us to look at wait statistics at the server level. While this information is useful, it doesn't allow us to look at wait statistics at a more granular level like per database or per session level. That's why in SQL Server 2005, sys.dm_os_waiting_tasks has to be polled constantly to look at the wait statistics using the Resource_Description column filtering only tempdb.
Extended Events are a new mechanism introduced in SQL Server 2008 to capture SQL Server performance data with low overhead compared to SQL Server profiler, server side tracing, DBCC commands and other utilities. The scope of Extended Events is far beyond this tip and please refer to the articles below for better understanding of this feature. Extended Events allow more granular level tracking that was impossible in prior SQL Server versions. Extended Events, XE in short, allows capturing performance monitoring data at individual database level or per session level and for this tip we will track information at the database level for tempdb. The queries below allow us to find out what information is available to track using Extended events.
--Find the event name allows to look at wait statistics
SELECT *
FROM sys.dm_xe_objects xo INNER JOIN sys.dm_xe_packages xp
   ON xp.[guid] = xo.[package_guid]
WHERE xo.[object_type] = 'event' AND xo.name LIKE '%wait%'
ORDER BY xp.[name];
GO

--Find the columns that are  available to track for the wait_info event
SELECT * FROM sys.dm_xe_object_columns
  WHERE [object_name] = 'wait_info';
GO

--Find the additional columns that can be tracked
SELECT *
FROM sys.dm_xe_objects xo INNER JOIN sys.dm_xe_packages xp
   ON xp.[guid] = xo.[package_guid]
WHERE xo.[object_type] = 'action'
ORDER BY xp.[name];
GO
The code snippet below creates the session and uses asynchronous filetarget command, which should be used as a best practice to avoid Ringbuffer overhead. The Ringbuffer uses 4 MB of data and if additional data is captured, then ringbuffer data is overwritten.
--Drop the event if it already exists
DROP EVENT SESSION Monitor_wait_info_tempdb ON SERVER;
GO

--Create the event
CREATE EVENT SESSION Monitor_wait_info_tempdb ON SERVER

--We are looking at wait info only
ADD EVENT sqlos.wait_info
(
   --Add additional columns to track
   ACTION (sqlserver.database_id, sqlserver.sql_text, sqlserver.session_id, sqlserver.tsql_stack)
    WHERE sqlserver.database_id = 2 --filter database id = 2 i.e tempdb
    --This allows us to track wait statistics at database granularity
) --As a best practise use asynchronous file target, reduces overhead.
ADD TARGET package0.asynchronous_file_target(
     SET filename='c:\Monitor_wait_info_tempdb.etl', metadatafile='c:\Monitor_wait_info_tempdb.mta')
GO

--Now start the session
ALTER EVENT SESSION Monitor_wait_info_tempdb ON SERVER
STATE = START;
GO
Let's run a test script to apply load on Tempdb by creating table variables and temp tables with and without named constraints. This code takes advantage of a technique from the Executing a T-SQL batch multiple times using GO tip.
--Now run the test load, using table variables, temp tables, temp tables with named constraints
DECLARE @test TABLE (c1 INT NOT NULL, c2 datetime)
INSERT @test SELECT 1, GETDATE()
GO 1000

--drop table #test
CREATE TABLE #test (c1 INT NOT NULL, c2 datetime)
INSERT #test SELECT 1, GETDATE()
DROP TABLE #test
GO 1000

CREATE TABLE #test (c1 INT NOT NULL, c2 datetime, CONSTRAINT pk_test PRIMARY KEY CLUSTERED(c1))
INSERT #test SELECT 1, GETDATE()
DROP TABLE #test
GO 1000
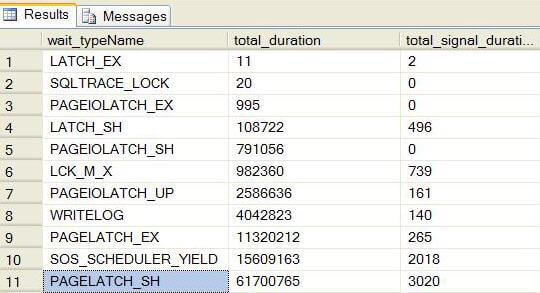
Once the script is completed, let's summarize the wait info statistics. I
ran these queries on my laptop and the results are listed below. The results show
significant IO issues with tempdb along with an allocation bottleneck.
SELECT wait_typeName
      , SUM(total_duration) AS total_duration
      , SUM(signal_duration) AS total_signal_duration
FROM (
SELECT
  FinalData.R.value ('@name', 'nvarchar(50)') AS EventName,
  FinalData.R.value ('data(data/value)[1]', 'nvarchar(50)') AS wait_typeValue,
  FinalData.R.value ('data(data/text)[1]', 'nvarchar(50)') AS wait_typeName,
  FinalData.R.value ('data(data/value)[5]', 'int') AS total_duration,
  FinalData.R.value ('data(data/value)[6]', 'int') AS signal_duration,
  FinalData.R.value ('(action/.)[1]', 'nvarchar(50)') AS DatabaseID,
  FinalData.R.value ('(action/.)[2]', 'nvarchar(50)') AS SQLText,
  FinalData.R.value ('(action/.)[3]', 'nvarchar(50)') AS SessionID

FROM
( SELECT CONVERT(xml, event_data) AS xmldata
   FROM sys.fn_xe_file_target_read_file
   ('c:\Monitor_wait_info_tempdb*.etl', 'c:\Monitor_wait_info_tempdb*.mta', NULL, NULL)
) AsyncFileData
CROSS APPLY xmldata.nodes ('//event') AS FinalData (R)) xyz
WHERE wait_typeName NOT IN ('SLEEP_TASK')
 GROUP BY wait_typeName
 ORDER BY total_duration
 GO
How to remove allocation bottleneck?
If you can recognize the allocation bottleneck for the TempDB database, then you can try the following techniques to reduce the bottleneck:
- For the TempDB database, create multiple data files. The recommended number of files is usually 1/4 to 1/2 of the number of CPU cores.
- Make sure the TempDB data files are of the same size to effectively use the proportional fill algorithm.
- Modify queries to avoid creating and dropping of temp tables excessively.
- Check queries and add indexes to avoid generating excessive IO.
- Use trace flag 1118 to force using uniform extents instead of mixed extents.
Next Steps
- Learn about Extended Events:
- Paul Randal - article
- Jonathan Kehayias - whitepaper
- Take a look at TempDB Monitoring and Troubleshooting: Allocation Bottleneck by Sunil Agarwal.
- Check out the Working with tempdb in SQL Server 2005 whitepaper.
- Check out the Should you create multiple files for a user DB on a multi-core box? by Paul Randal.
- Check out these additional tips:


About the author
 Sankar Reddy is a Database Engineer/DBA and SQL Server MVP. He has been working with SQL Server since 2003 in a variety of roles.
This author pledges the content of this article is based on professional experience and not AI generated.
View all my tips
