By: Tim Ford | Comments (11) | Related: 1 | 2 | 3 | 4 | 5 | 6 | > Query Plans
Problem
First, you click the 'New Query' button on the top left of SQL Server Management Studio to have a new query window to execute a query. Second, you click the 'Execute' icon on the toolbar or press the F5 key to process a query. Third, SQL Server does some processing behind the scenes. Fourth, results are returned. These are the four steps to retrieving information from Microsoft SQL Server. Three of which are pretty straightforward and happen in the light of day. You see the commands, parameters, object names, keywords and the like being laid down on the display in front of you when entering T-SQL commands. You are the one clicking the Execute or F5 key. You see the results as they are returned. Is there not a way to see how SQL Server goes about taking the gibberish of T-SQL and converting it to understandable rows of data? Of course there is. It's the graphical execution plan!
Solution
The graphical execution plan is just that. It is a tool that presents in images and text, the process by which SQL Server steps through the query, parsing, hashing, and building the results set using the information it has available (statistics, indexes, and the raw data). There are actually two other flavors of execution plans that we will not be discussing at this time: text execution plan and an xml execution plan. We will save those for another tip as it is necessary to have a good understanding of the graphical execution plan before moving on to those others that afford more detail.
There are two types of graphical execution plans: the estimated execution plan and the actual execution plan. They are precisely what the names imply (yes, a rarity in technology). The estimated execution plan is an estimate based upon the query optimizer on what it expects to occur when executing the query whereas the actual execution plan show what did actually occur when generating the results. For the purpose of this tip I'll be showing you how to run either graphical execution plan, but once that is presented the discussion will turn towards reading the basic graphical execution plan and will be agnostic as to whether it is the actual or estimated plan.
Presenting An Execution Plan
For the purpose of this tip we will be using the Northwind database. I've established a connection to my test instance and have opened a new query to the Northwind database. The query is below and we will use this throughout this tip:
SELECT [CustomerID], [CompanyName], [City], [Region]
FROM [Northwind].[dbo].[Customers]
WHERE [Country] = 'Germany'
ORDER BY [CompanyName]
The estimated execution plan is engaged from the standard toolbar in SQL Server Management Studio as is highlighted below:
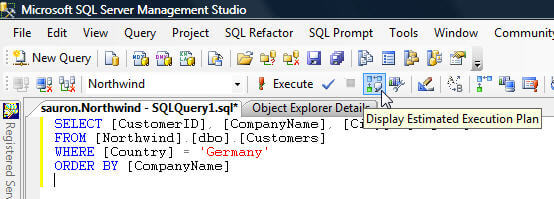
You can also use the Ctrl+L hotkey, right click the query window and select 'Display Estimated Execution Plan', or select 'Query/Display Estimated Execution Plan' from the SSMS menu bar to accomplish the same task.
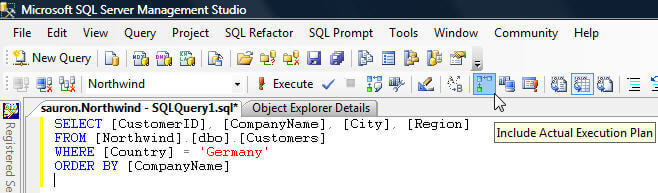
Presenting the Actual Execution Plans is slightly different, more so in behavior than in the functionality that triggers presentation of the query plan. Just as with Estimated Execution Plans there is a button in the SSMS application, you can right click the query and select 'Include Actual Execution Plan' from the pop-up window or do likewise from the menu bar; there is also a hotkey for Actual Execution Plans (in this case Ctrl+K). Enabling the Actual Execution Plan is a behavioral toggle for the SSMS application. This means that once you click the associated button, each time you execute any query you create in this or any query tab within SSMS the Actual Execution Plan for that query will be displayed. Clicking the button a second time turns off the behavior. The assigned button is shown below:
In the case of such a simple query as this one, both the actual and estimated query plans are identical. As a matter of fact, from this point, we will ignore whether the query plan we're observing is the Actual Execution Plan or the Estimated Execution Plan.
Reading the Graphical Execution Plan
Let's look at the execution plan for the aforementioned query and we'll begin the discussion on how to read such a plan. It is slightly nonsensical to those of us in Western culture and you'll see why in a second.
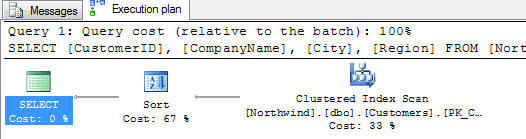
So why would I call this nonsensical? Take a look at the direction the arrows point within the execution plan and you'll see why. You read a graphical execution plan right-to-left. In future articles in this series you'll also see that in truth we read them right-to-left and top-to-bottom. For those of you who like to jump ahead to the good stuff in books I give you the following example of what you'll observe in terms of a more-complex execution plan similar to what we will digest in detail later in the series:
SELECT C.[CompanyName], OD.[ProductID], OD.[Discount],
  OD.[Quantity], OD.[UnitPrice],
  O.[OrderDate], O.[RequiredDate], O.[ShippedDate]
FROM Orders O
  INNER JOIN [dbo].[Order Details] OD
     ON O.[OrderID] = OD.[OrderID]
  INNER JOIN [dbo].[Products] P
     ON OD.[ProductID] = P.[ProductID]
  INNER JOIN [dbo].[Customers] C
     ON C.[CustomerID] = O.[CustomerID]
WHERE O.[ShippedDate] > O.[RequiredDate]
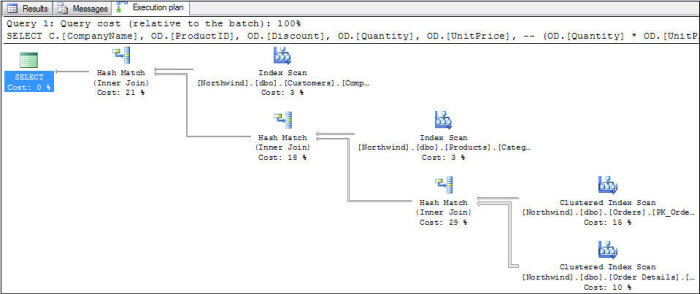
The specifics of this more advanced query are unimportant at this time; all that is important is that you understand that the general reading of the query plan is, as I have stated right-to-left and top-to-bottom. This more advanced query also highlights another notable display behavior and that is the size of the arrow used to denote the flow of data from one process to the next. The thickness of the arrow correlates to the number of rows flowing between the steps. But I digress...Let's get back to the first execution plan, shall we? Besides the flow of information and arrow symbolism you'll also notice that each step/process has an associated cost. This is a percentage of cost for the step compared to the total cost of all steps in the query plan. Rounding is obviously involved, so when you do see 0% for a cost you need to understand that some time was incurred to complete the step. Nothing, I repeat NOTHING is free in a SQL query. There is yet another cost presented initially in the query plan and that is located in the header for the graphical query plan. This cost is a factor if you run more than a single T-SQL statement in a batch. Each statement will have an associated query plan, and this metric displays the cost for each statement when compared to the total for all statements run in the batch. As a final task in this tip let's take a quick look at this behavior. What happens when we execute the following two statements in the same execution batch?
SELECT [CustomerID], [CompanyName], [City], [Region]
FROM [Northwind].[dbo].[Customers]
WHERE [Country] = 'Germany'
ORDER BY [CompanyName]

SELECT [CustomerID], [CompanyName], [City], [Region]
FROM [Northwind].[dbo].[Customers]
WHERE [Country] = 'Germany'
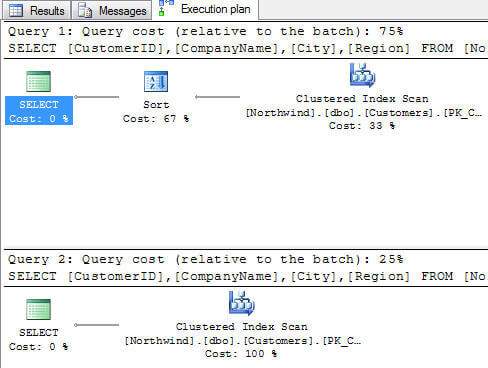
The statements were identical, other than the ORDER BY clause was omitted from the second statement. When you compare the two statements, the metrics presented show that the first query consumes 75% of the total execution time for the batch, whereas the second query consumes only 25% of the batch's total cost. This is a relative cost metric, as labeled appropriately.
Summary
To summarize, graphical execution plans:
- There are a variety of methods for displaying or triggering graphical execution plans
- You read them right-to-left and top-to-bottom
- The arrows denote not just the direction of data travel, but also (comparatively) amount of data rows being transferred from step-to-step in the execution process
- Costs are displayed for each step, relative to the total cost of the query plan
- The cost for the statement can be compared to other statements run in the same batch
In subsequent tips we will explore many of the various types of processes you'll see presented as individual steps in the query execution plan. We will also explore the additional wealth of information presented as pop-ups and properties of each step within the SQL Server Management Studio.
Next Steps
- Query plans are essentials to understand how the SQL Server optimizer is processing data and assessing a cost for the query.
- Check out these related tips to learn more about Query Plans


About the author
 Tim Ford is a Senior Database Administrator with MindBody.
This author pledges the content of this article is based on professional experience and not AI generated.
View all my tips
