By: Ray Barley | Comments (3) | Related: > Performance Tuning
Problem
In order to monitor and tune SQL Server you need to collect and review all sorts of information such as performance counters, SQL Server Profiler traces, the output from many dynamic management views (DMVs), the Windows Event Log and SQL Server Error Logs. You can collect performance counters using the System Monitor, run the SQL Server Profiler to capture events from SQL Server, query DMVs using SQL Server Management Studio, run the Database Tuning Advisor to analyze things, etc. It's overwhelming just talking about it. Is there a single tool that I can use to collect all the information I need?
Solution
SQLDIAG is a general purpose diagnostics collection utility that can be used to support your SQL Server performance monitoring and tuning efforts. In this tip I will provide an introduction to the tool that will allow you to start using it to collect the kind of information you need to monitor and tune SQL Server.
SQLDIAG is a command line utility that is included with SQL Server. Using SQL Server 2005 as an example, the default folder location for the SQLDIAG utility is C:\Program Files\Microsoft SQL Server\90\Tools\Binn. As with most command line tools, there are many options that can be specified. You can get the details of the various options from the SQLDIAG page in Books on Line.
As mentioned in the problem statement above, one of the most arduous tasks in gathering the information you need for monitoring and tuning is getting just what you need from the many different sources of data and getting it all in one place where you can review and analyze it. SQLDIAG solves the problem by allowing you to specify what you want to collect in an XML configuration file. A portion of the XML file is shown below:
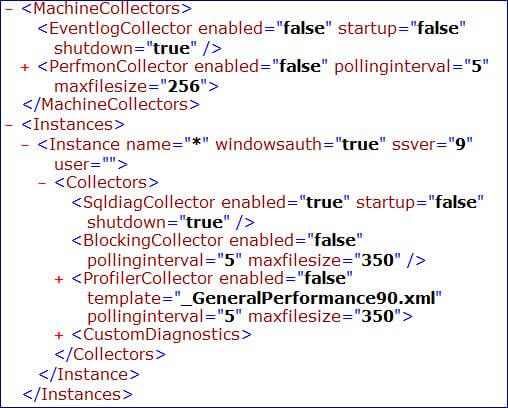
The XML file shown above is the default one that comes with SQL Server. The file name is SQLDiag.XML and it will be used automatically; you can use a command line option to specify a different file. There are a number of collectors; you set their enabled property to true or false as appropriate. There are three collectors that are collapsed - PerfmonCollector, ProfilerCollector and CustomDiagnostics. You can expand these and fine tune what you collect. The PerfmonCollector allows you to specify the performance monitor counters to collect, the ProfilerCollector allows you to choose the SQL Server Profiler events to collect, and the CustomDiagnostics allows you to specify your own T-SQL commands to be executed.
I find the CustomDiagnostics to be the most interesting. A sample is shown below:
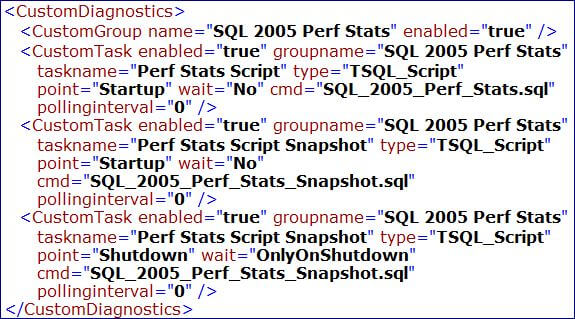
The above sample was taken from a CSS SQL Server Engineers blog posting. It shows how you can specify your own T-SQL scripts to be run as part of the SQLDIAG collection process. This gets you closer to collecting just what you want. You can specify scripts to run selected DMVs or any other T-SQL commands that you like. In the above example the SQL_2005_Perf_Stats_Snapshot.sql script is run at startup and again at shutdown. The SQL_2005_Perf_stats.sql script is run at startup; it creates two stored procedures and runs them every 10 seconds. The CSS SQL Server Engineers blog post example provides a good starting point and the samples are available for download. The output from the scripts in the CustomDiagnostics section is captured in text files.
Now we're ready to launch SQLDIAG and review the output. For our demonstration purposes I will use the sample code from the CSS SQL Server Engineers blog post. Download the code sample and put the files in the folder of your choice. The post provides two .cmd files; one runs a SQL Server Profiler trace and the other doesn't.
To run SQLDIAG without the SQL Server Profiler trace, open a Command Prompt and run this command (all on one line):
START SQLDIAG /I "%cd%\SQLDiagPerfStats_NoTrace.XML" /O "%cd%\SQLDiagOutput" /P |
The following is the description of the command line options:
- /I specifies the SQLDIAG XML configuration file.
- /O specifies where to put the output files. The current directory is substituted for %cd%.
- /P specifies the support folder path where the various files can be found such as the T-SQL scripts in the CustomDiagnostics section of the XML configuration file. By default this is under the SQL Server folder in Program Files. /P with no argument uses the current directory.
To run SQLDIAG and include the SQL Server Profiler trace, run this command (all on one line):
START SQLDIAG /I "%cd%\SQLDiagPerfStats_Trace.XML" /O "%cd%\SQLDiagOutput" /P |
As you can see the above examples each supply a different SQLDIAG XML configuration file. Each time you run SQLDIAG you can change the /O command line option to specify a different folder for the output files.
Due to space constraints on our web page I'm not going to show any screen shots of the output files but I will describe their contents. You can download my sample and review the various files. After running the command to launch SQLDIAG that includes the SQL Server Profiler trace, you will see the following:
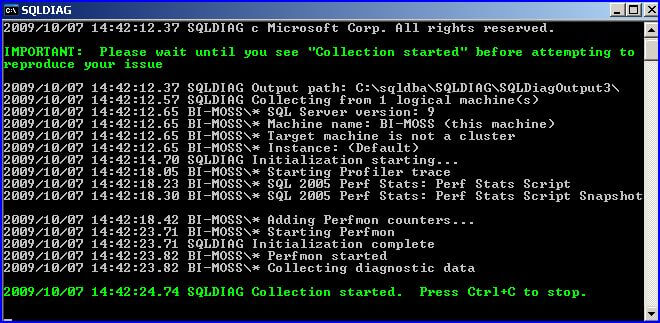
From the above screen shot you can see the details on the machine name and what diagnostics are being collected. At any point you can stop SQLDIAG by typing Ctrl+C. The following are the highlights of the output files generated (BI-MOSS is the name of my test server which is running SQL Server 2005 and SharePoint 2007 on a Windows 2003 Server):
- SQLDIAG.BLG contains performance monitor counters. If you would like to analyze the performance monitor data in Excel, use the RELOG utility to create a CSV file from the BLG file; see our earlier tip Free Microsoft Tools to Help Setup and Maintain PerfMon for SQL Server.
- BI-MOSS__SQL_2005_Perf_Stats_Snapshot_Startup.OUT contains the output from running the SQL_2005_Perf_Stats_Snapshot.sql at startup. It contains performance data on the top N query plans in the procedure cache (use counts, CPU usage, duration, reads, writes, etc.), missing indexes, current database options, and database statistics (row counts, row modification counts, last updated, etc.).
- BI-MOSS__SQL_2005_Perf_Stats_Snapshot_Shutdown.OUT contains the output from running the SQL_2005_Perf_Stats_Snapshot.sql at shutdown.
- BI-MOSS__sp_trace.trc is the trace file captured from running the SQL Server Profiler. You can open it up in the profiler to view.
- BI-MOSS__SQL_2005_Perf_Stats_Startup.OUT contains the output from the SQL_2005_Perf_stats.sql script. There is a wealth of information here including the list of current requests, blocked process report, active queries using a lot of resources, wait statistics, selected SQL Server performance counters, SQL processor utilization, database file information, etc.
- BI-MOSS__sp_sqldiag_Shutdown.OUT contains the SQL Server error logs, database configuration values, SQL Server version information, list of extended stored procedures, and the output from a variety of DMVs.
An interesting side note about SQLDIAG is that it's original purpose was to gather all of this useful information and send it to Microsoft so they could use it to diagnose some reported SQL Server issue. It has the capability to collect everything necessary to troubleshoot a SQL Server issue.
Next Steps
- Download the sample code from the CSS SQL Server Engineers blog post to start experimenting with SQLDIAG. You will find that there isn't a lot in Books on Line and the only way to get up to speed is to just start using it.
- SQLDIAG generates a voluminous amount of data. Pay close attention to how much disk space you are using. Remember you can fine tune what's collected by editing the XML configuration file.
- Take a look at SQLDIAG in Books on Line. There are a lot of useful command line options like specifying a begin and/or end time, setting up SQLDIAG as a service, etc.


About the author
 Ray Barley is a Principal Architect at IT Resource Partners and a MSSQLTips.com BI Expert.
This author pledges the content of this article is based on professional experience and not AI generated.
View all my tips
