By: Ray Barley | Comments (9) | Related: > Performance Tuning
Problem
I have identified one production database in particular where the business users are constantly complaining about slow performance. I would like to focus strictly on identifying and mitigating issues related to query performance in that database. What's the best tool to analyze a workload and identify improvements?
Solution
The Database Engine Tuning Advisor (DTA) is a performance tuning tool that was first available with SQL Server 2005. DTA replaced the Index Tuning Wizard in previous versions of SQL Server. In a nutshell DTA analyzes a workload and makes recommendations that will enhance query performance; e.g.:
- Adding indexes (clustered, nonclustered, and indexed views)
- Adding partitioning
- Adding statistics including multi-column statistics which are not created automatically even when you have the AUTO_CREATE_STATISTICS database option set to ON
In addition to identifying all sorts of opportunities for improvement, DTA will create a T-SQL script that you can run to actually implement its recommendations.
There are several ways that you can launch DTA:
- Use the Start menu and navigate to the Performance Tools folder in the SQL Server program group
- Select DTA from the Tools menu in SQL Server Management Studio (SSMS)
- Select DTA from the Tools menu in SQL Server Profiler
- Select Analyze Query in Database Engine Tuning Advisor on the SSMS Query menu from a query window, allowing you to pass a T-SQL batch to DTA for analysis
- Type DTA from a Command Prompt; add -? to the command line to see the available options
You typically create a workload by putting together a group of queries in a text file or by running SQL Server Profiler. The key point to consider is that the workload you pass to DTA for analysis should be representative of the typical workload. The recommendations are based on what DTA sees in the workload. If the workload is very limited the recommendations may not be optimal. Usually the best bet is to capture the workload by running SQL Server Profiler, save the trace to a file, and pass that file on to the DTA. I will demonstrate this approach.
Launch SQL Server Profiler from the Performance Tools folder of the SQL Server program group in the Start menu or from the Tools menu in SSMS. Create a new trace and fill in the dialog as shown below:
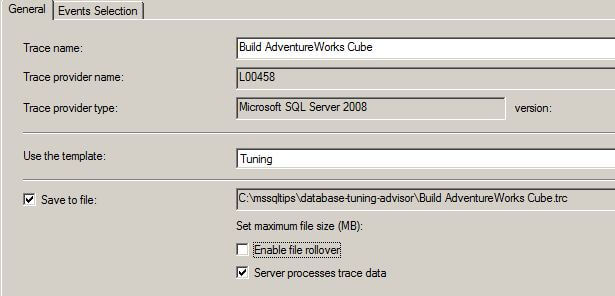
The following are the main points about the general properties of the new trace:
- Select Tuning from the dropdown list for the trace template; this template collects all of the events that are required by DTA.
- Check Save to file and specify a file name; you can pass this file to DTA when the trace is done.
- The workload used for this tip is to build the Adventure Works 2008 cube using the sample SQL Server Analysis Services project that you can download from this page. To generate a lot of recommendations I removed the indexes from the AdventureWorksDW database then processed the cube.
Click on the Events Selection tab to review the events and columns selected:
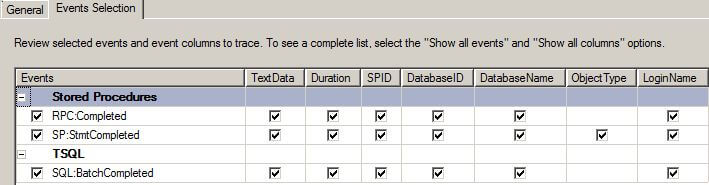
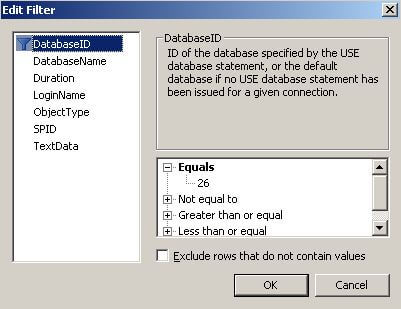
You may want to add a filter to the trace to limit the information that is collected. For instance you may want to collect trace information from a single database. To do that click the column filters button on the Events Selection dialog (not show in the above screen shot) and enter your filter(s). In my case I want to filter on the DatabaseId column as shown below (the AdventureWorksDW database that I'm using has a DatabaseId = 26):
Start the profiler trace by clicking the Run button on the Trace Properties dialog and let it run for a period where you will capture a representative workload. Stop the trace by selecting Stop trace from the File menu in SQL Server Profiler. Launch DTA from SQL Server Profiler by selecting Database Engine Tuning Advisor from the Tools menu; fill in the dialog as follows:
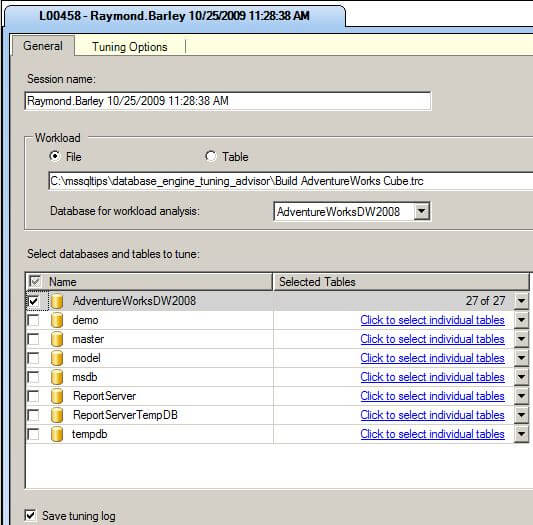
The following are the main points about the DTA General properties dialog:
- Click the File radio button and specify the trace file created by running the SQL Server Profiler
- Select the database for workload analysis
- Select the database to tune; you can select more than one and you can also drill in and specify individual tables; I just selected one database and all tables
- Click the Save tuning log checkbox; this will save the results automatically in the MSDB database and they can be recalled within DTA at a later time
Click the Tuning Options tab and fill in the dialog as follows:
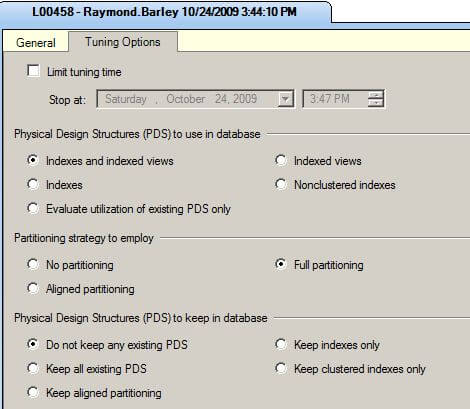
The Tuning Options allow you to specify your choices for physical design structures, partitioning, and whether to keep the existing physical design structures. These options are mutually exclusive so you may want to run the analysis more than once if necessary to specify different options. If you have a limited amount of time that you want to allow DTA to run, click the Limit tuning time checkbox and specify a stop time. Click Start Analysis on the DTA top-level menu to begin the analysis. When DTA completes the analysis, you will be presented with recommendations and their estimated improvement percentage, as well as a number of reports that you can review. For the recommendations you can choose from the following options on the DTA Actions menu:
- Apply Recommendations will implement the recommendations; you can apply immediately or schedule a time
- Save Recommendations will save the recommendations to a file; you can review and apply as you see fit
- Evaluate Recommendations allows you to pick and choose from among the recommendations and evaluate their impact
Saving the recommendations is probably your best bet. You should review them and apply them as you see fit. DTA creates the T-SQL commands to implement the recommendations. The following is a sample of the recommendations, showing creating a multi-column statistic, a nonclustered index, and an indexed view:
CREATE STATISTICS [_dta_stat_325576198_10_2]
ON [dbo].[FactResellerSales] (
    [SalesOrderNumber]
  , [OrderDateKey]
)
go
CREATE NONCLUSTERED INDEX [_dta_index_DimCustomer_8_37575172__K1_K20]
ON [dbo].[DimCustomer] (
  [CustomerKey] ASC
, [EnglishOccupation] ASC
)
WITH (
  SORT_IN_TEMPDB = OFF
, IGNORE_DUP_KEY = OFF
, DROP_EXISTING = OFF
, ONLINE = OFF
) ON [PRIMARY]
go
CREATE VIEW [dbo].[_dta_mv_530] WITH SCHEMABINDING
 AS
SELECT
  [dbo].[DimCustomer].[Phone] as _col_1
, count_big(*) as _col_2
FROM  [dbo].[DimCustomer]
GROUP BY  [dbo].[DimCustomer].[Phone]
go
CREATE UNIQUE CLUSTERED INDEX [_dta_index__dta_mv_530_c_8_1639676889__K1]
ON [dbo].[_dta_mv_530] (
 [_col_1] ASC
)WITH (
  SORT_IN_TEMPDB = OFF
, IGNORE_DUP_KEY = OFF
, DROP_EXISTING = OFF
, ONLINE = OFF
) ON [PRIMARY]
go
One of the things you probably want to change is the object names. DTA generates these in a generic way; you would be better off to follow your own naming conventions.
DTA generates a number of reports based on its analysis of your workload as shown below:
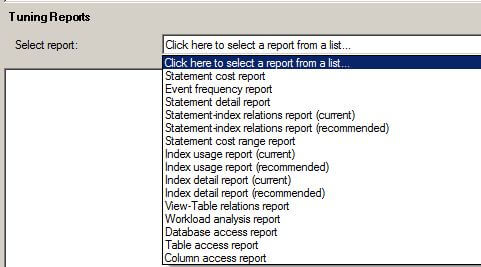
The following are some highlights of these reports:
- Statement Cost Report - shows the percent improvement of each statement in the workload if the recommendations are implemented
- Statement Detail Report - shows the current cost of the statement and the cost if the recommendations are implemented
- Statement-Index Relations Report (Recommended) - shows the statements in the workload and the index recommendations
- Index Usage Reports - show the current and recommended indexes and how often they are utilized
- Index Detail Reports - show the size (in MB) and number of rows in the current and recommended indexes
- Workload Analysis Report - shows the number of statements that have a lower cost, an increased cost or no change if the recommendations are implemented
- Table Access Report - shows the number of times and percentage that a table is used in the workload
- Column Access Report - shows the number of times and percentage that a table column is used in the workload
Next Steps
- The Database Engine Tuning Advisor is a tool that you should consider using when you want to focus on performance tuning your queries.
- Take a look at DTA in Books on Line to get additional details.
- For a list of Performance Tuning tips navigate to this page.


About the author
 Ray Barley is a Principal Architect at IT Resource Partners and a MSSQLTips.com BI Expert.
This author pledges the content of this article is based on professional experience and not AI generated.
View all my tips
