By: Tim Ford | Comments (5) | Related: 1 | 2 | 3 | 4 | 5 | 6 | > Query Plans
Problem
In the article, SQL Server Query Execution Plans in SQL Server Management Studio, I gave you an initial look into how to launch and read a graphical query execution plan. We're going to dive deeper into the different opportunities for information sources within the graphical execution plan itself. Yes, you read that right. There are other sources of information in the graphical execution plan that are not readily apparent at first blush. This tip will focus on Tooltips and the next on the Properties window.
Solution
Those of you who have been reading my articles for the past two years have heard me state the values of being able to read Microsoft. What I mean is that Microsoft as a software development company spends many hours ensuring that their products have similar graphical user interface (GUI) design and behavior. Frequent users of their products be they accountants using Excel or DBAs using SQL Server Management Studio know that if they were to select Tools from the menu bar in their application that they could drill down into Options and then make modifications to their instance of the product. They know that if they right click in the application they will get a pop-up window with additional options. They also know about the tool Tooltips that occasionally pop-up when you hover over a toolbar button or area of the GUI long enough; those little yellow boxes with additional read-only information about the specific aspect of the GUI that they are hovering the mouse over at that point in time.
SQL Server Management Studio Execution Plan Tooltips
Just like the many other Microsoft products, SQL Server Management Studio also has those tooltips. The graphical query execution plan takes it to a new level, with monster-sized tooltips as you will soon see.
Remember that first query and graphical execution plan I presented in the earlier tip in the series? If not, here it is below. I will continue to use it as the basis for our discussion. This is a very simple SELECT statement against the Northwind sample database in SQL Server, with a filter and sort operation thrown in for good measure.
SELECT [CustomerID], [CompanyName], [City], [Region]
FROM [Northwind].[dbo].[Customers]
WHERE [Country] = 'Germany'
ORDER BY [CompanyName]
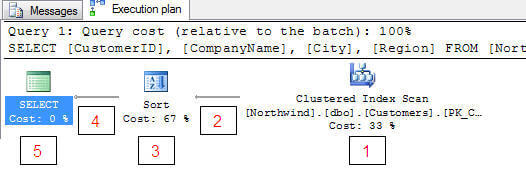
In the above estimated execution plan, I have added numbers 1 through 5 to help better explain each operation.
Let's look at the tooltips for each of the operations in this simple execution plan, working our way from right-to-left just as you would read the plan itself. You will see similarities between the tooltips for each operation, but you should note that there are quite a few differences as well. You also may be surprised to learn that even the arrows denoting data flow between the operator icons have associated tooltips.
So, if you hover over each item in the execution plan you will get different information. The following shows each set of information for these 5 parts of this execution plan.
1 - Clustered Index Scan Operator
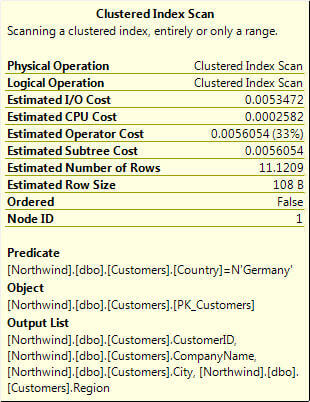
I want to take some time here to review each of the metrics offered in this, the first tooltip we've looked at so far. From here we will only focus on the new / different line items in subsequent tooltips for each operation. You'll see that the tooltip presents the type of operation as well as a standardized description of the operation initially. This is followed by (in the case of estimated execution plans) estimated operational metrics. If this was an actual execution plan you would have also seen the Actual Number of Rows involved in the operation after the Physical Operation and Logical Operation metrics.
- Physical Operation - the physical operation for this part of the execution plan, such as joins, seeks, scans...
- Logical Operation - the logical operation for this part of the execution plan
- Estimated I/O Cost - these are relative values used for presenting whether a given operation is I/O intensive. The Query Optimizer assigns these values during parsing and they serve only as a comparative tool to aid in determining where the costs of a given operation lie. The larger the value, the more cost-intensive the process.
- Estimated CPU Cost - these are relative values used for presenting whether a given operation is CPU intensive. The Query Optimizer assigns these values during parsing and they serve only as a comparative tool to aid in determining where the costs of a given operation lie. The larger the value, the more cost-intensive the process.
- Estimated Operator Cost - This is the summation of the I/O and CPU estimated costs. This is the value that is also presented under each operation icon in the graphical execution plan.
- Estimated Subtree Cost - This is the total of this operation's cost as well as all other operations that preceded it in the query to this point.
- Estimated Number of Rows - This value is derived based upon the statistics available to the Query Optimizer at the time the execution plan is drafted. The more current (and the larger the sampling size of the statistics) the more accurate this metric and others will be when compared to the actual data.
- Estimated Row Size - Also based upon the statistics available at the time of parsing, this value corresponds to how wide the Query Optimizer believes the affected rows to be. The same rule applies to statistics here as well as with the Estimated Number of Rows - the more current and descriptive the data set used to generate the statistics - the more accurate this value will be in comparison to the actual data. Good stats also lead to better (more accurate) decisions made by the Query Optimizer when actually processing your queries.
- Ordered - is a Boolean value signifying whether the rows are ordered in the operation.
- NodeID - Is the ordinal value associated with this particular operation in the query execution plan. Oh, and thank you for the confusion Microsoft for numbering the operations in a left-to-right fashion, even though we are to read the execution plans right-to-left. Greatly appreciated!
Other items available in actual execution plans
- Actual Number of Rows - The actual number of rows if the query was run.
- Actual Rebinds and Actual Rewinds - The topic of rebinds and rewinds is outside the scope of this tip. Suffice to say the value is incremented in different manners when a given operation process is initialized. A change in correlated parameters within a join would be noted as a rebind - the join would need to be re-evaluated, whereas a rewind count is incremented if these parameters are not changed and the existing join can be used for subsequent processing. What compounds the complexity of this subtopic is that not all operations present rebinds and rewinds to the Query Optimizer. I will point you many times to an excellent book by a good friend of mine and outstanding SQL Server Professional, Grant Fritchey. His book on the subject of query execution plans is a fantastic wealth of information and is widely available as either a hard copy or as a free digital download. He does a good job of explaining the topic of rebinds and rewinds. Any attempt I would make to do so would just be a re-hashing of the material he provides in his book.
These line items are then followed by the Predicate, Object, and Output List of columns for the operator. Predicate is the term used to describe the portion of a query used to filter, describe, or compare sets of data. In this case it the portion of the query that filters the results for just those rows where the country of interest is equivalent to 'Germany'. The object used as a tool to accomplish this task for this specific operator was the primary key on the Customers table. The output list is just that, the list of columns that are output from the process being described: CustomerID, CompanyName, City, and Region (the columns that are to be returned in our SELECT statement.
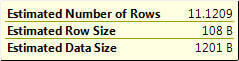
2- Data Flow Arrow: from Clustered Index Scan Operator to Sort Operator
Can you tell by just this tooltip whether we're reviewing an actual or an estimated graphical execution plan? It's not as simple as you would expect. Both types of graphical execution plans provide these rows in their tooltip.
However, the actual query plan also includes the Actual Number of Rows:
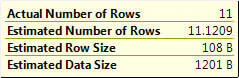
The tooltips associated with the data flow arrows are quite simple, they provide information relating to the estimated (or actual) data moving between operations in a query.
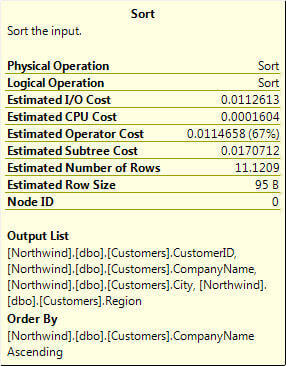
3 -Sort Operator
The tooltip for the Sort operator and Clustered Index Scan operator are identical in the metrics they capture. Obviously the values for these metrics differ. You'll see that the Estimated Subtree Cost has now been incremented by the cost of this operation as well as all preceding operations.
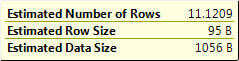
4 - Data Flow Arrow: from Sort Operator to SELECT Operator
Identical in content (but not necessarily values) we next encounter the data flow arrow between the Sort and SELECT operations. We're almost done!
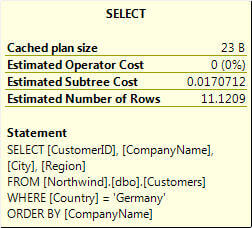
5- SELECT Operator
Take note that the SELECT operator's tooltip is drastically different from the other operator tooltips we've seen so far - the DML (Data Modification Language actions such as INSERT UPDATE DELETE) will also differ compared to the other operators we've seen to date as well as the SELECT operator presented here. We will look at the other DML operator's tooltips as they come into the discussion in future tips. In the case of the SELECT operator we have a new line item: Cached plan size. Cached plan size denotes the amount of memory this query plan is consuming in the stored procedure cache. This value is useful if you are troubleshooting memory issues specifically-related to cache performance.
Summary
There you have it. Our initial dive into reading the wealth of information presented in the tooltips for the graphical query execution plans in Microsoft SQL Server. These tooltips provide us with substantially more information than the graphic portion of the execution plan. From costing information to amount of actual data affected at each step of the process, the tooltips give us a greater insight into why and how the Query Optimizer responds to our T/SQL code. Our next tip in the series will focus on the Properties window available to us in SQL Server Management Studio as it pertains to execution plans.
Next Steps
- SQL Server Query Execution Plans in SQL Server Management Studio
- Maximizing You View Into SQL Query Plans


About the author
 Tim Ford is a Senior Database Administrator with MindBody.
This author pledges the content of this article is based on professional experience and not AI generated.
View all my tips
