By: Scott Murray | Comments (2) | Related: > Power BI
Problem
I heard Power BI Desktop has a focus mode? Is that for images? What exactly does it do? How can I better manage the visualizations in Power BI? How can I embed my images in Power BI?
Solution
As you work with PowerBI, one of the common ways you will want to interact with PowerBI site is to drill into a chart, table, or other visualization. Microsoft added the focus functionality in one of the most recent updates which gives you a way to drill into a visualization at both the chart level and further to see the underlying data.
As I alluded to in the Problem Statement, the focus functionality does not relate to adding an image or link. Along with being able to focus on a single report, Microsoft also added the ability to added graphics, images, logos, and links to a PowerBI reports.
To get started with these functions, the first step is to download the latest edition of Power BI Desktop (PBID) from: https://powerbi.microsoft.com/en-us/downloads/. Additionally, you need to do a few things to get everything setup for access including signing up to access Power BI at http://powerbi.microsoft.com. Note that you must use a work or school address to sign up for Power BI. Gmail, Yahoo, and similar accounts will not work. Once you have your account setup, you are ready to start exploring the features available in Power BI including using the focus mode and adding logos and images.
Coming into Focus with Power BI
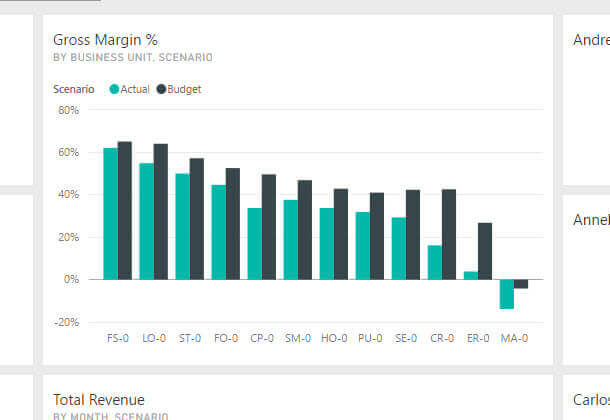
So what does focus mode really do? The focus mode takes the selected visualization, whether it is from a dashboard tile or a report visualization, and expands and enlarges it to cover the screen. This enlargement allows a Power BI viewer to see more distinct data points and trends of course, but the added advantage is it also includes the ability to open the filter pane and adjust as needed. Such filtering is not available in the regular view. Furthermore, focus mode is not synonymous with full screen mode which is really just a full expansion of the current view to cover all areas of the current window.
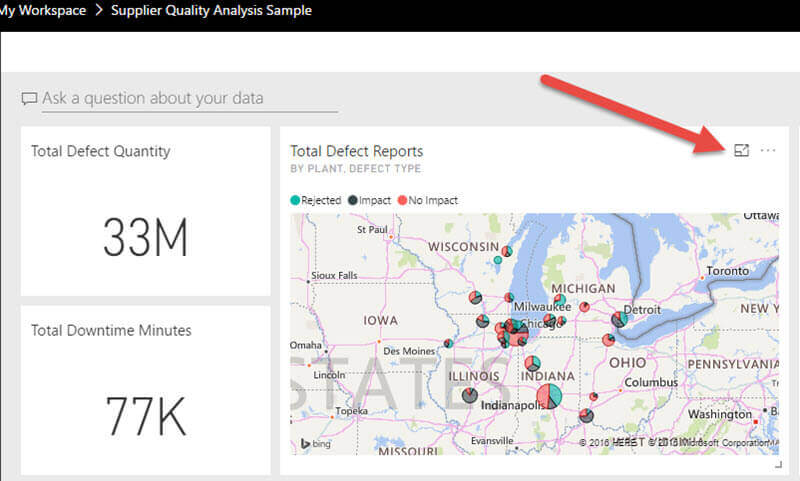
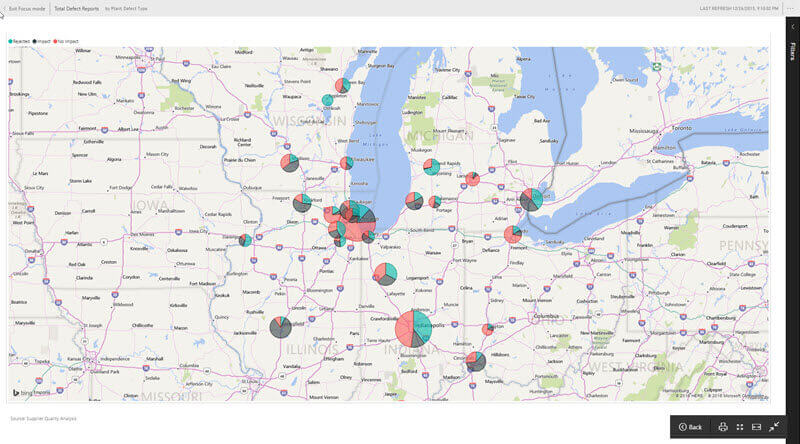
To focus on a Power BI visual, you simply click the focus button, which looks like two boxes with an arrow pointing up and to the right, as shown below.
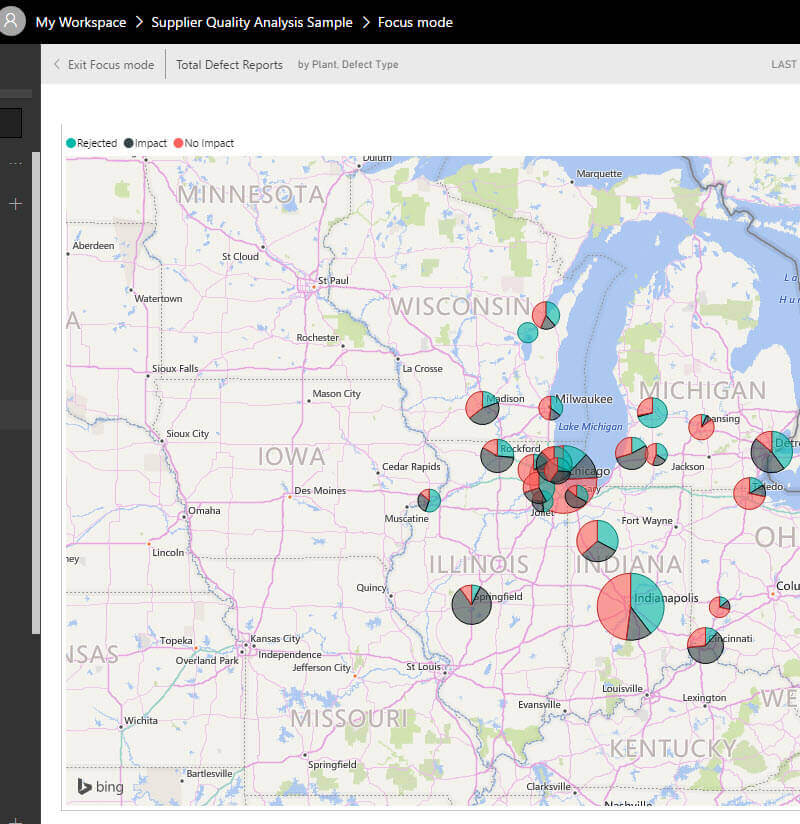
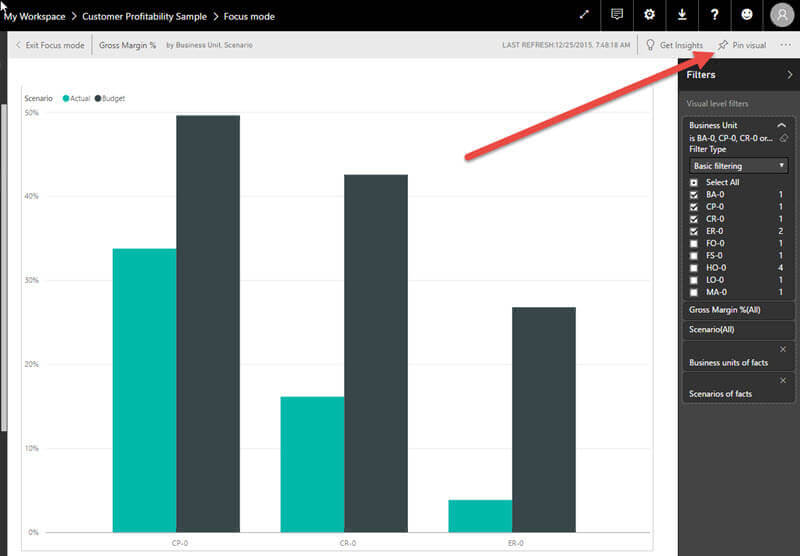
As shown in the below screen print, we now have a much larger map that covers the entire presentation area on the report or dashboard.
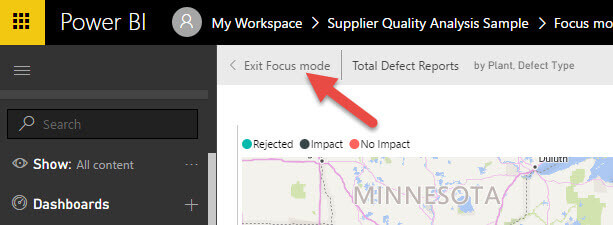
To remove the focus, click the Exit Focus mode button.
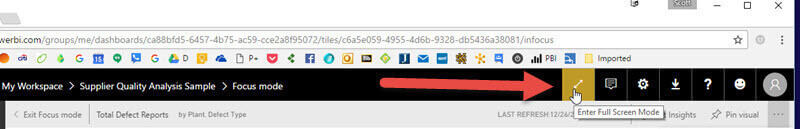
While in focus mode, you can switch to full screen mode. Notice how full screen
mode removes all the buttons and menu items.
In Focus Mode Filters for Power BI
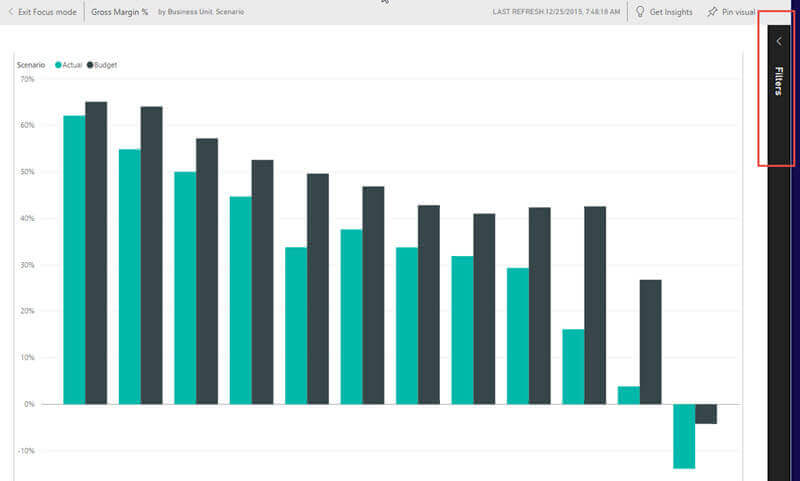
For filters you can actually interact with a page or visualization filter depending on the objects in focus. However, I find the Filter option is sort of hidden in an out of the way location. As illustrated below, the filter expand button appears on the upper right corner of the Focus Mode pane.
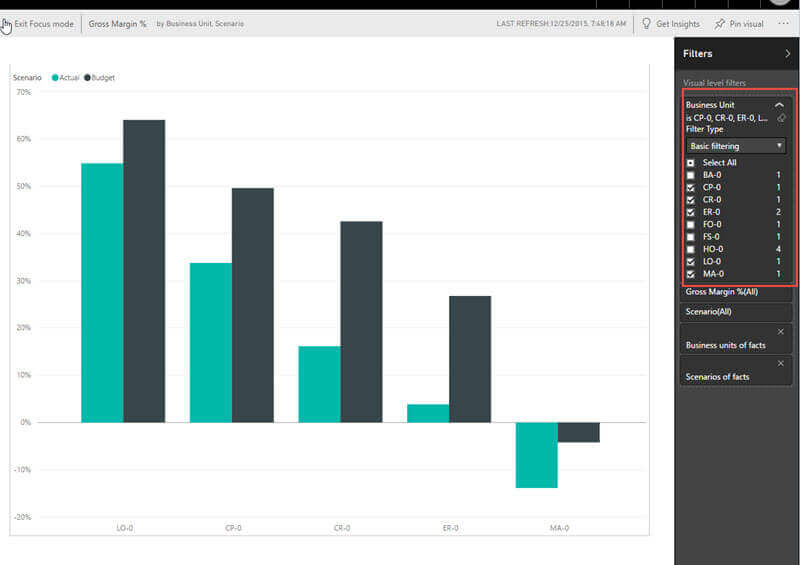
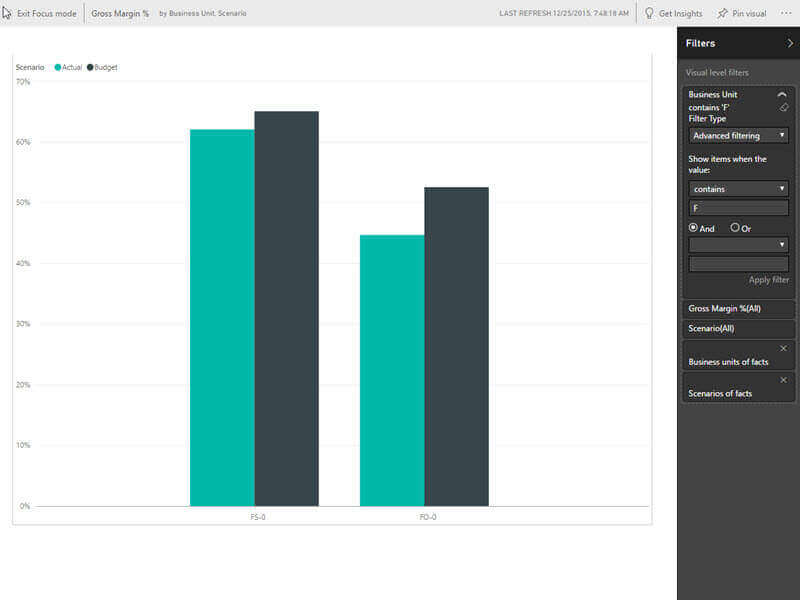
Once the filter pane is open, the data points available for filtering are shown. Clicking on the data value header (for instance Business Unit, Gross Margin %, Scenario) opens the filter panel; as illustrated in the below two screen prints, you can choose either the basic method or the advanced method to use to apply the filters. The basic mode allows for the selection of available data values whereas the advanced mode allows you to customize the criteria evaluators such as "contains" or "starts with". Each has their own benefits, but these filter modifications provide an easy way to interact with the visualization. The results of applying both these filter modes is shown in the next two illustrations.
You should note, though, that once you Exit Focus Mode, the filters are reset to the original values and original visualization is displayed.
Pin a Visual in Power BI
Alternatively, you can apply your desired filters and actually pin the adjusted In Focus visual back to a dashboard and shown below.
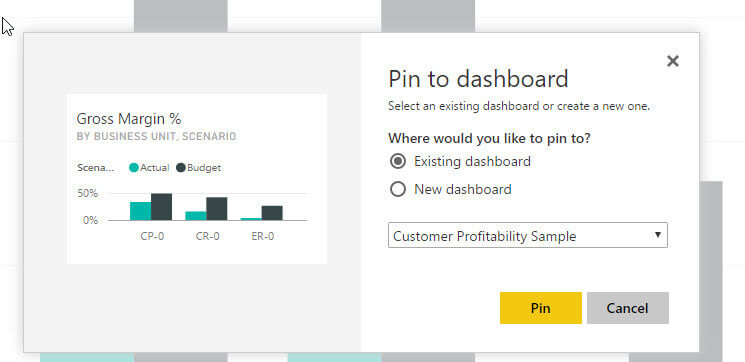
Upon completing the pinning, the modified visualization is now part of the report or dashboard, with the selected filters applied as shown next. We could actually put this new pinned visual In Focus mode, and add or remove values (or all values) from the filter list.

See Data Functionality in Power BI
Finally, and probably one of my more favorite options is using the See Data functionality. On reports only (not Dashboards) and when using the In Focus mode, a report viewer can quickly see the data details behind the visualization. To see this drill down, the report viewer selects Explore > See Data.
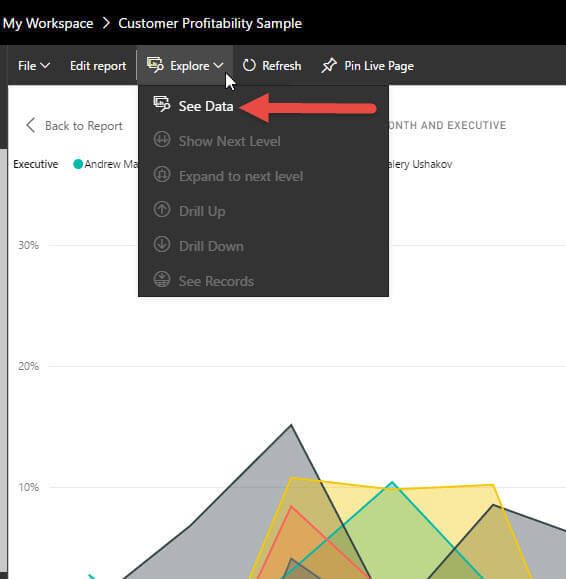
As illustrated next, the data grid displays below the In Focus visualization.
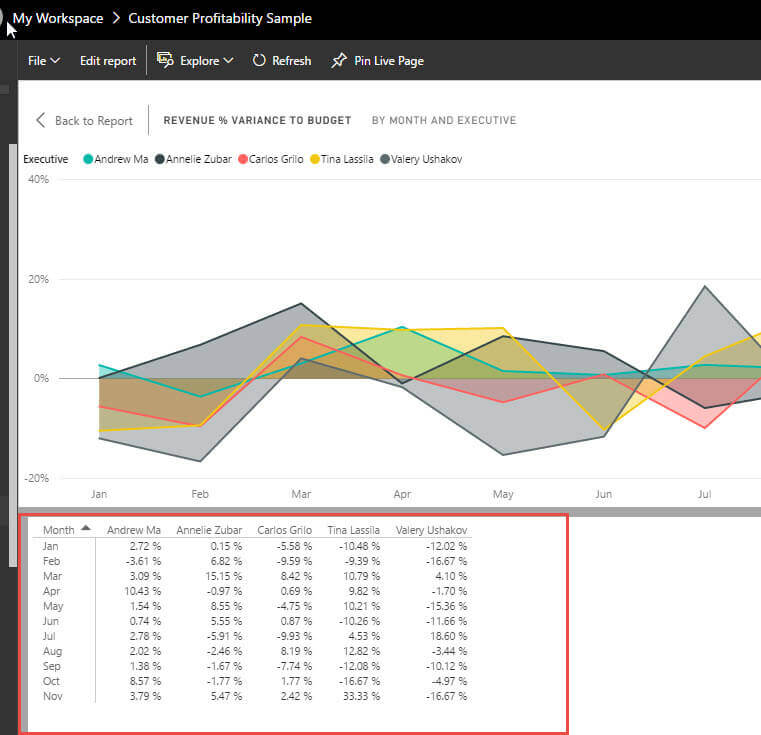
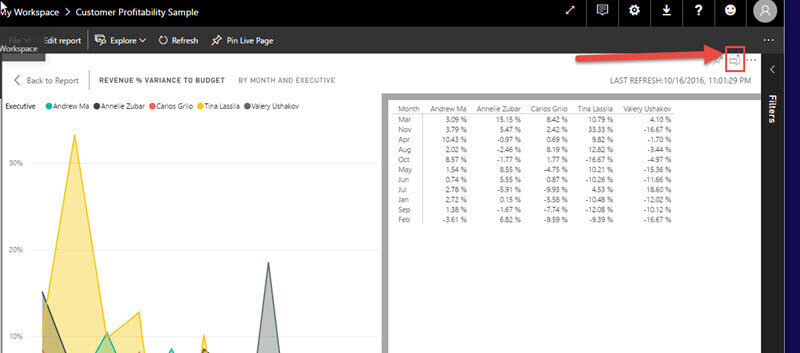
Using what I call the flip button, you can toggle the view between vertical and horizontal presentation.
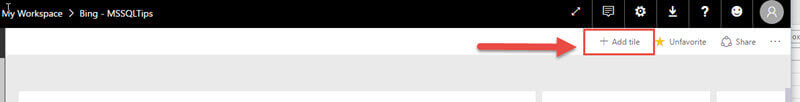
Adding a Tile or Image or Two
We are going to switch our "Focus" from a specific visual to adding an image or other object to your PowerBI Dashboard. The process of adding these objects falls under the Add Tile option.
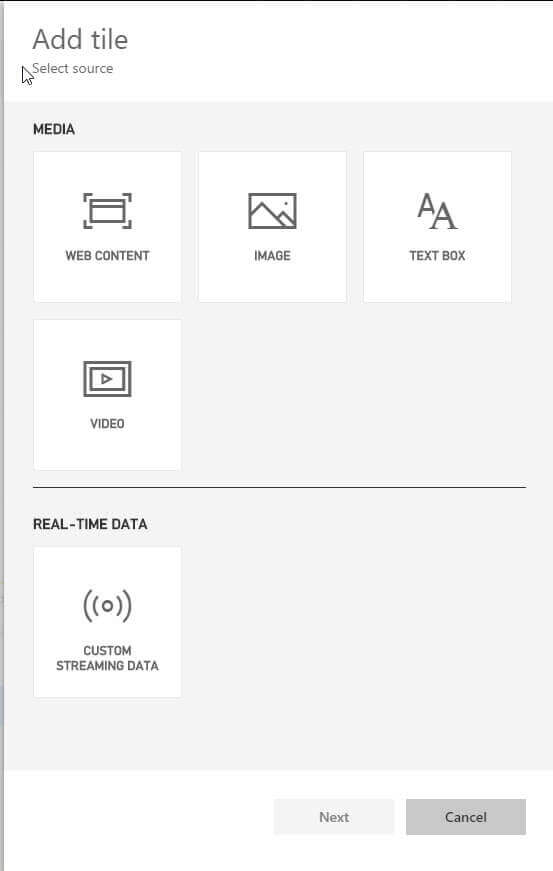
As shown in the below screen shot, Power BI offers us the ability to display:
- Web Content - Using html coding and tags like iframe to display content.
- Image - Image must be accessed via a URL.
- Text box - Adds a text box with text and potential to add simple links.
- Video - Video must be accessed via a URL.
- Streaming Data - Data is streamed through a custom API.
For the first four option, you can also add an embedded link.
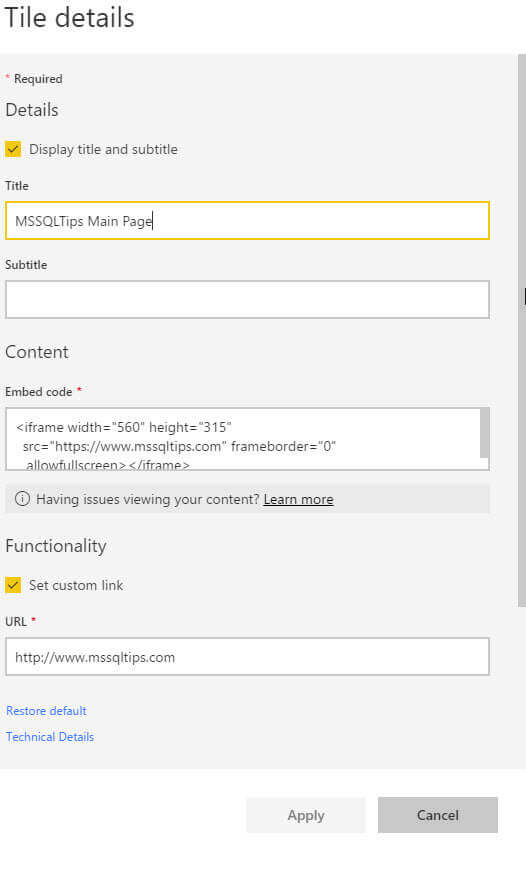
Using Add Web Content for our example, we first decide if we want to add a Title / SubTitle and then specify each as desired. Next we need to define the content we want to display. You can of course copy this code from another source or hand code your HTML content. In the below example, we use an Iframe, but you also are able to embed full HTML coding for a page. Finally, we can decide if a custom link should be added; that option is a simple URL.
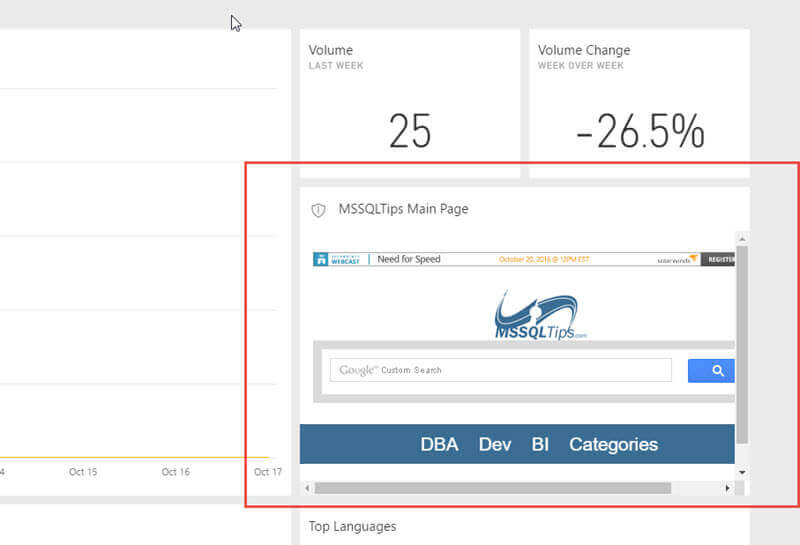
Following along with our above example, we now have a Tile on our dashboard that
contains our requested content, the MSSQL Tips home page in this case.
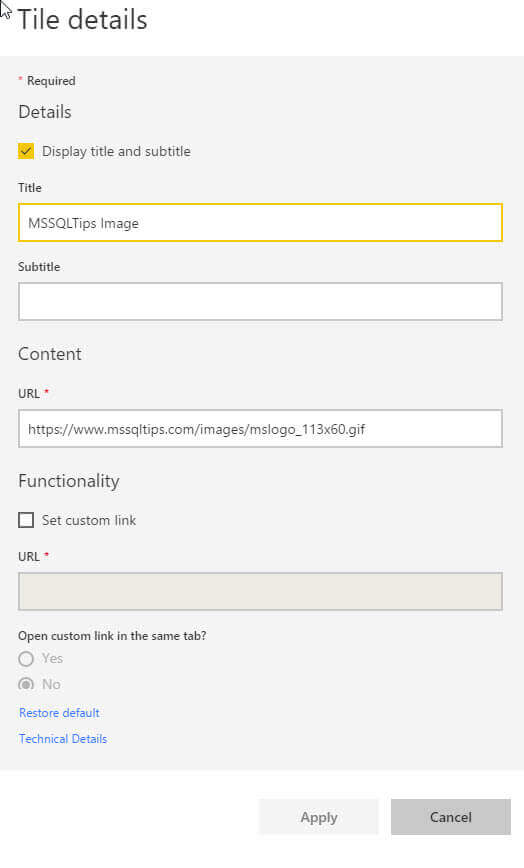
In a similar fashion, we can add an Image tile. Notice how we reference the URL
location of the image.
Now we have a tile with our MSSQLTips image on our dashboard.
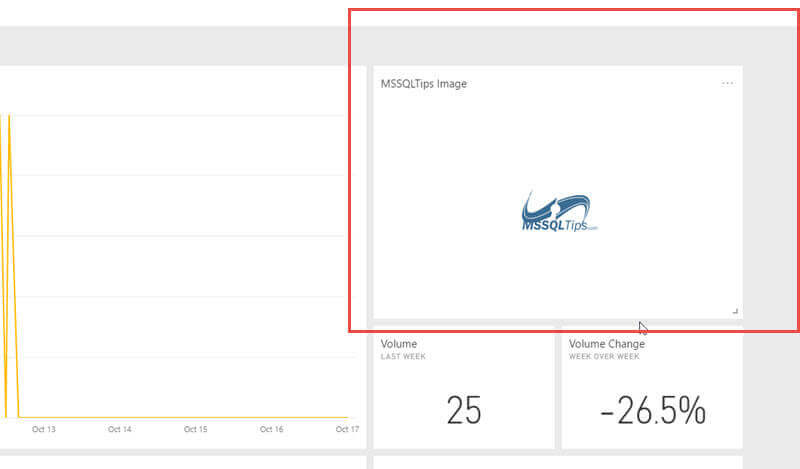
We can certainly resize the tile with the image if we desire.
Conclusion
The Focus mode functionality within PowerBI provides a welcomed ability to zoom into a visualizations details, first by expanding the visualizations size and then if needed offering the ability explore the underlying data. Focus mode differs from full screen mode in that focus mode is only concerned with a single visual, while full screen mode displays whatever is currently displayed in full screen. Continuing with the focus theme, we can also add new tiles to a Power BI dashboard which provide the ability to add images, web content, streaming data, and text boxes.
Next Steps
- Review all the Power BI Tips on MSSQLTips https://www.mssqltips.com/sql-server-tip-category/211/power-bi/
Learn more about Power BI in this 3 hour training course.


About the author
 Scott Murray has a passion for crafting BI Solutions with SharePoint, SSAS, OLAP and SSRS.
This author pledges the content of this article is based on professional experience and not AI generated.
View all my tips
