By: Koen Verbeeck | Comments (3) | Related: > Analysis Services Development
Problem
The DAX query language – used in Analysis Services Tabular, Power Pivot and Power BI – contains some powerful functions. One of these functions is the relatively new TREATAS. In this tip, we’ll introduce you to the syntax and concepts of the function and show some uses cases where this function can be useful.
Solution
The TREATAS function applies the result of a table expression as a filter to the columns of an unrelated table. In other words, you can use it to apply filters to a table while there is no relationship present. In a normal scenario, tables are related to each other and when one table is filtered, the filter will propagate using the relationship. With TREATAS, we can filter unrelated tables, which makes it a really useful function to have in your toolbox.
The syntax is as follows:
TREATAS(table expression, column[, other optional columns])
Let’s illustrate the concept of the function with a simple example. The following model is an import from the AdventureWorks data warehouse, where only a few columns have been kept:
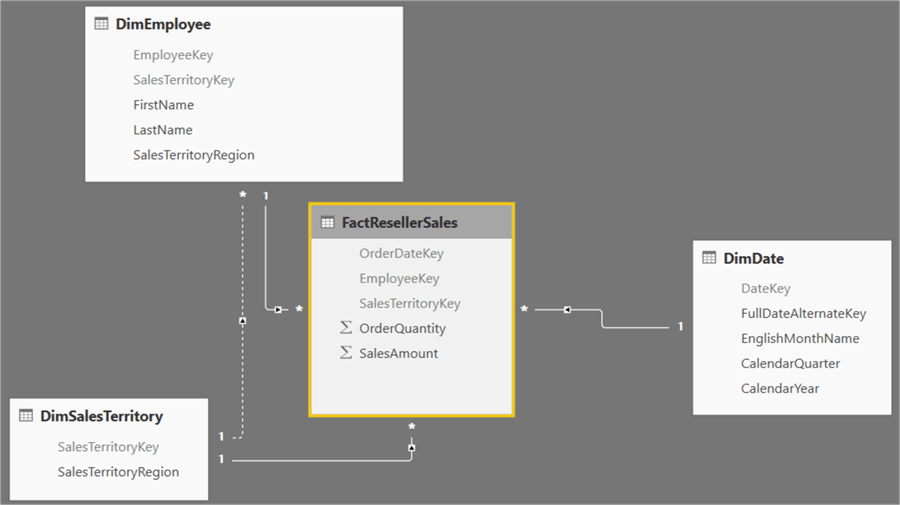
The Sales Territory dimension is directly related to the fact table, but employees also have a sales territory. In the model a relationship is created, but it is not active, as it would result in ambiguity. We can say the employee dimension and the sales territory dimension are unrelated, as no bi-directional filtering is enabled anywhere in the model. With TREATAS, we can create a measure that when the sales territory region in the employee dimension is filtered, it will also filter the sales territory dimension for the same region. The result will only be sales done in a sales territory by employees of that sales territory. Sales from employees outside the territory will be discarded. The formula is as follows:
SalesAmount (excl Blended Sales) = CALCULATE(SUM(FactResellerSales[SalesAmount]),TREATAS(VALUES(DimEmployee[SalesTerritoryRegion]),DimSalesTerritory[SalesTerritoryRegion]))
We can verify the result when comparing the measure with the original SalesAmount measure:
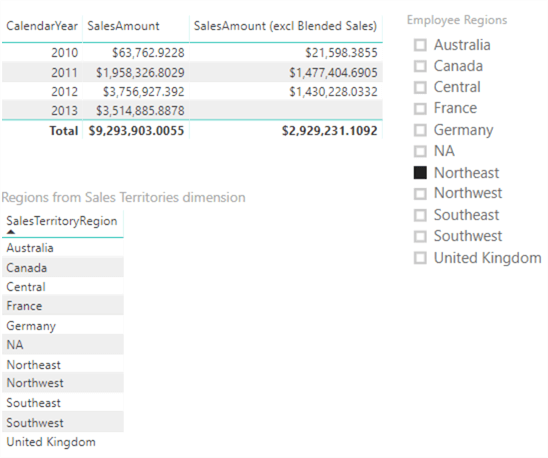
In the screenshot above, we filter on the Northeast employee territory. The sales excluding “foreign” employees are visibly lower. Keep in mind the filter on the sales territory dimension is only applied in the measure itself. The table on the bottom – displaying all the regions from the dimension – is unaffected by the slicer.
Another example of using TREATAS is described in the tip DAX Enhancements in Analysis Services 2017.
Dynamically Switching Dimensions
With TREATAS, you can solve some scenarios in a creative way. Suppose we want to dynamically change the columns on a matrix by using a slicer. This scenario is inspired by the blog post Dynamically switching axis on visuals with Power BI by Kasper de Jonge.
Initially we have the following matrix:
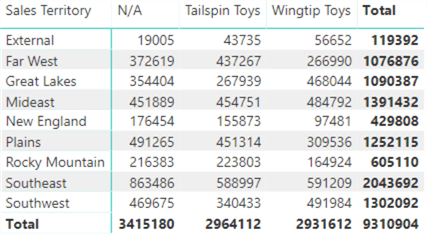
By selecting another value on a slicer, we want to change columns of the matrix automatically:
The data comes from a Tabular model using the WideWorldImporters data warehouse as a source. The tip Using Calculated Tables in Analysis Services Tabular 2016 for Aggregate Tables – Part 3 has a walkthrough on how you can create such a Tabular model.
The key to the solution is to create a disconnected table holding all the possible values that can be put on the columns axis of the matrix. It will serve two purposes:
- The grouping of those values will be displayed in the slicer. E.g. “buying groups” and “years”.
- The individual values will be displayed on the columns axis.
Let’s create a view in the WideWorldImporters data warehouse that will fetch the data in the above format:
CREATE VIEW dbo.DynamicDimension AS
SELECT DISTINCT
    [Category]  = 'Years'
   ,[Values]    = CONVERT(VARCHAR(30),[Calendar Year])
FROM [WideWorldImportersDW].[Dimension].[Date]
UNION ALL
SELECT DISTINCT
    [Category]  = 'Buying Groups'
   ,[Values]    = [Buying Group]
FROM [WideWorldImportersDW].[Dimension].[Customer];
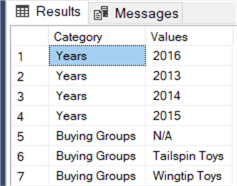
The result set contains the following data:
Now we need to add this view as a new table in the Tabular model. Depending on how your model was built, you can either create a new query with the “modern get data” functionality or you can add a new table using the legacy connectors. The tip What's New in Analysis Services Tabular 2017 has a section on the modern get data experience and on how you can use the legacy connectors.
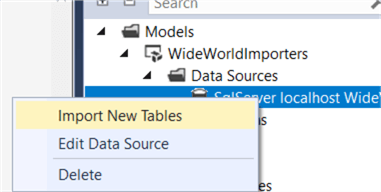
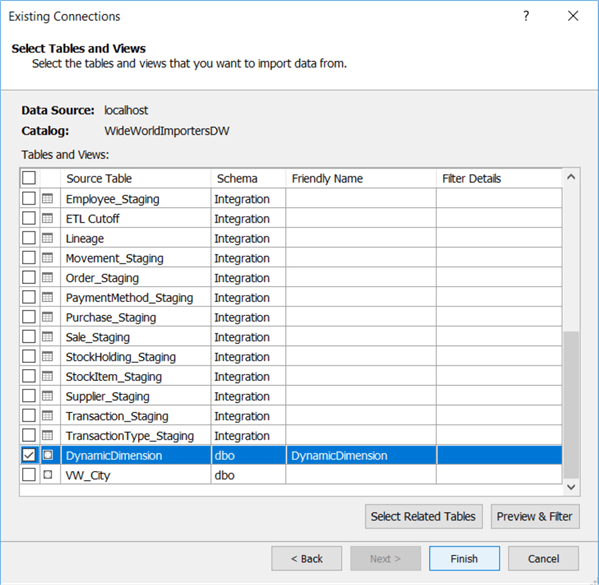
Choose the newly created view from the list and import it into the model. There is no need to create a relationship with any of the other tables.
The next step is to create a measure that will change depending on the value we have chosen in the Category column. It will need to do the following:
- Check if only one single category is chosen. If multiple values are chosen – e.g. Years and Buying Groups – nothing should be returned.
- Inspect the value chosen for category and push it as a filter to the corresponding dimension using TREATAS.
The formula becomes:
DynamicQuantity:=
IF(HASONEVALUE(DynamicDimension[Category])
    ,SWITCH(VALUES(DynamicDimension[Category])
                        ,"Years",CALCULATE(SUM('Order'[Quantity]),TREATAS(VALUES(DynamicDimension[Values]),'Date'[Calendar Year]))
                        ,"Buying Groups",CALCULATE(SUM('Order'[Quantity]),TREATAS(VALUES(DynamicDimension[Values]),Customer[Buying Group]))
    )
)
As you can see, the result is blank when nothing is selected:
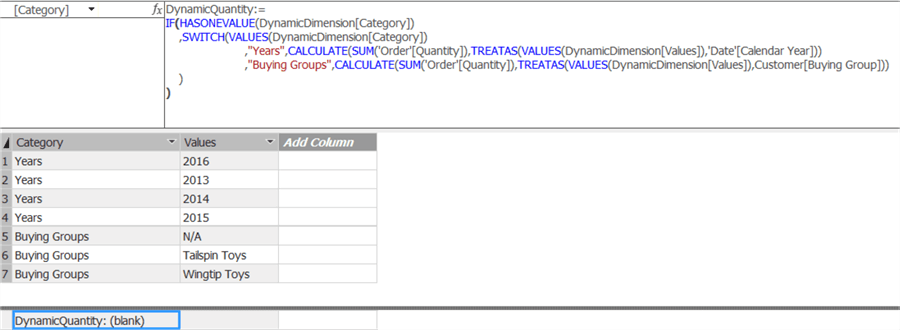
The HASONEVALUE function checks for the first criteria, that only one category should be selected. The SWITCH function will evaluate the selected category and return the correct calculation corresponding with the chosen category. The calculation itself is the sum of quantity, where the category is pushed down as a filter to the correct dimension using TREATAS by using CALCULATE.
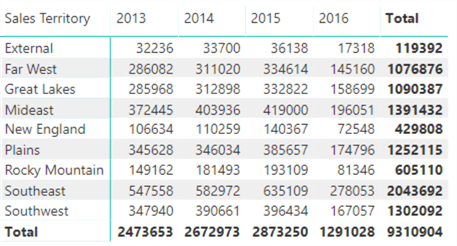
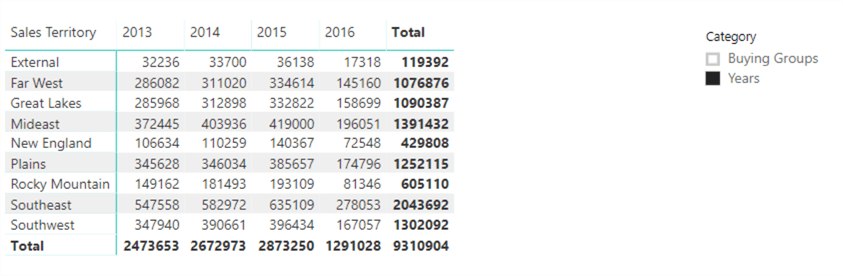
We can now create our dynamic matrix:
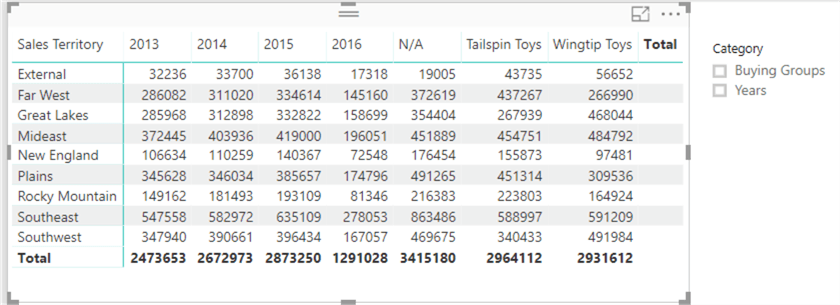
The Values column of the DynamicDimension table is put on the columns axis, while Sales Territory remains on the row axis. The DynamicQuantity measure is put in the values field. In the screenshot above you can see both categories are displayed in the columns when no selection is made in the slicer. However, the Total column is blank thanks to the use of HASONEVALUE. By selecting items in the slicer, we can change the layout of the matrix:
If you want to make the rows dynamic as well, the formula becomes more complex as you need to take the various possible combinations of the rows and columns intersections into account. The blog post Virtual Filters Using TREATAS has examples of how to use TREATAS with multiple columns.
Other Use Cases
The main concept of TREATAS will always be the same: create a virtual relationship between tables. But you can use it in various situations:
- You can use TREATAS as an alternative to the IN operator. However, the IN operator will most likely have the best performance.
- Kasper has another great blog post where the relationships are dynamically switched using TREATAS: Dynamic relationships based on the selection.
- Virtual filters can also be created with FILTER or INTERSECT. The article Propagating filters using TREATAS in DAX gives a good introduction to TREATAS and compares it with the alternatives. A must-read for deeper understanding of this new DAX function.
Next Steps
- You can follow the steps described in this tip to create your own solution using TREATAS. You can download the .pbix file with the first example here. It requires a connection with the AdventureWorks data warehouse.
- More information about new DAX functions can be found in the tip DAX Enhancements in Analysis Services 2017. Other new features in Analysis Services Tabular 2017 are described in the tip What's New in Analysis Services Tabular 2017.
- You can find more Analysis Services tips in this overview.


About the author
 Koen Verbeeck is a seasoned business intelligence consultant at AE. He has over a decade of experience with the Microsoft Data Platform in numerous industries. He holds several certifications and is a prolific writer contributing content about SSIS, ADF, SSAS, SSRS, MDS, Power BI, Snowflake and Azure services. He has spoken at PASS, SQLBits, dataMinds Connect and delivers webinars on MSSQLTips.com. Koen has been awarded the Microsoft MVP data platform award for many years.
This author pledges the content of this article is based on professional experience and not AI generated.
View all my tips
