By: Brady Upton | Comments (5) | Related: 1 | 2 | 3 | 4 | > Dynamic Management Views and Functions
Problem
I'm trying to tune my SQL Server and I'm having a hard time deciding if my CPU is under a lot of stress. What's a quick and easy way to detect CPU pressure? Check out this tip to learn more.
Solution
There are a few different ways to detect CPU pressure, for example, Performance Monitor or SQL Profiler, but in this tip we'll discuss the wait type SOS_SCHEDULER_YIELD and the DMV sys.dm_os_schedulers.
Some of you might have seen the wait type SOS_SCHEDULER_YIELD and wondered what in the world is this? Books Online (BOL) describes this wait type as:
Occurs when a task voluntarily yields the scheduler for other tasks to execute. During this wait the task is waiting for its quantum to be renewed.
SOS_SCHEDULER_YIELD is a fairly common wait type and occurs when there is CPU pressure. SQL Server runs multiple threads and tries to allow all threads to run without problems. However, if all the threads are busy on each scheduler and can't let other threads run, it will yield itself for another thread, which in turn creates the SOS_SCHEDULER_YIELD wait type.
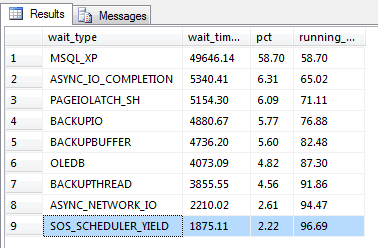
You can see the top wait stats and the percentage of waits at the current point in time by running the following query by Tim Ford and Glenn Berry.
WITH Waits AS
(
SELECT
wait_type,
wait_time_ms / 1000. AS wait_time_s,
100. * wait_time_ms / SUM(wait_time_ms) OVER() AS pct,
ROW_NUMBER() OVER(ORDER BY wait_time_ms DESC) AS rn
FROM sys.dm_os_wait_stats
WHERE wait_type
NOT IN
('CLR_SEMAPHORE', 'LAZYWRITER_SLEEP', 'RESOURCE_QUEUE',
'SLEEP_TASK', 'SLEEP_SYSTEMTASK', 'SQLTRACE_BUFFER_FLUSH', 'WAITFOR',
'CLR_AUTO_EVENT', 'CLR_MANUAL_EVENT')
) -- filter out additional irrelevant waits
SELECT W1.wait_type,
CAST(W1.wait_time_s AS DECIMAL(12, 2)) AS wait_time_s,
CAST(W1.pct AS DECIMAL(12, 2)) AS pct,
CAST(SUM(W2.pct) AS DECIMAL(12, 2)) AS running_pct
FROM Waits AS W1
INNER JOIN Waits AS W2 ON W2.rn <= W1.rn
GROUP BY W1.rn,
W1.wait_type,
W1.wait_time_s,
W1.pct
HAVING SUM(W2.pct) - W1.pct < 95; -- percentage threshold;
After running this query on one of my servers I can see that only 2.22% of my waits are due to CPU pressure so I can rule that out as a cause for poor performance. (This is only current since the last SQL Service restart):
If you see a high percentage of this wait type then one way of troubleshooting this is to use the DMV sys.dm_os_schedulers. BOL describes sys.dm_os_schedulers as:
Returns one row per scheduler in SQL Server where each scheduler is mapped to an individual processor. Use this view to monitor the condition of a scheduler or to identify runaway tasks.
This DMV has several columns including number or workers, active tasks, and the status of each scheduler, etc., which can help troubleshoot certain problems, but the most important column is the one used for measuring queued tasks, the runnable_tasks_count column. This column displays the count of tasks yielding to other tasks resulting in a SOS_SCHEDULER_YIELD wait type. If this column is frequently greater than 0 then CPU pressure may be present and blocking may occur.
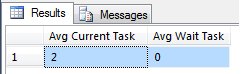
To see an average of current tasks and current waiting tasks you can use the following query:
SELECT AVG(current_tasks_count) AS [Avg Current Task],
AVG(runnable_tasks_count) AS [Avg Wait Task]
FROM sys.dm_os_schedulers
WHERE scheduler_id < 255
AND status = 'VISIBLE ONLINE'
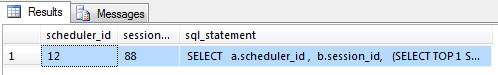
Another useful query that will display all statements being run and the associated scheduler that the statement is running on is:
SELECT
a.scheduler_id ,
b.session_id,
 (SELECT TOP 1 SUBSTRING(s2.text,statement_start_offset / 2+1 ,
      ( (CASE WHEN statement_end_offset = -1
         THEN (LEN(CONVERT(nvarchar(max),s2.text)) * 2)
         ELSE statement_end_offset END)  - statement_start_offset) / 2+1))  AS sql_statement
FROM sys.dm_os_schedulers a
INNER JOIN sys.dm_os_tasks b on a.active_worker_address = b.worker_address
INNER JOIN sys.dm_exec_requests c on b.task_address = c.task_address
CROSS APPLY sys.dm_exec_sql_text(c.sql_handle) AS s2
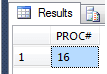
BOL mentions each scheduler is mapped to a processor so if we run the following query we can see how many processors SQL Server is using:
SELECT COUNT(*) AS proc#
FROM sys.dm_os_schedulers
WHERE status = 'VISIBLE ONLINE'
AND is_online = 1
While buying more CPU's is the easy answer to fixing these problems, it may not be the best answer. Tuning expensive queries can also help reduce the number of runnable_tasks_count. For example, if you have a poor performing query, adding more CPU's may not help at all.
The following query will show current tasks running, CPU time, wait type, etc.:
SELECT s2.text,
session_id,
start_time,
status,
cpu_time,
blocking_session_id,
wait_type,
wait_time,
wait_resource,
open_transaction_count
FROM sys.dm_exec_requests a
CROSS APPLY sys.dm_exec_sql_text(a.sql_handle) AS s2
WHERE status <> 'background'
Once you have tuned your environment and you are still continuously seeing the runnable_tasks_count column greater than 0, you might have a good argument for adding more CPU's. Determining how many CPU's is a choice you as a DBA will have to make based on your baseline and the results captured since.
I, personally, prefer using DMV's over Performance Monitor and Profiler because it's faster to setup and easier for me to read. Running a trace can be difficult unless you know what the exact problem is and Performance Monitor has hundreds of counters to choose from. I know some DBA's have been using Performance Monitor and Profiler for years and will argue, but I think DMV's are the future and Microsoft seems to be focusing on adding more DMV's to each version release and less time on Performance Monitor and Profiler.
Next Steps
- Check out Tim Ford's tip on "SQL Server sys.dm_os_wait_stats DMV Queries" where he talks more about the query used to see the top wait stats and the percentage of waits at the current point in time.
- A good way to test you server before production is to use a stress tool that will simulate a normal workload and look for high SOS_SCHEDULER_YIELD wait types.


About the author
 Brady Upton is a Database Administrator and SharePoint superstar in Nashville, TN.
This author pledges the content of this article is based on professional experience and not AI generated.
View all my tips
