By: Arshad Ali | Comments (8) | Related: > Microsoft Excel Integration
Problem
Microsoft Business Intelligence stack provides several tools for analyzing data from different perspectives, in different format and different ways. Power View is a new addition to this arsenal which provides intuitive ad hoc reporting capabilities for business users to provide an interactive data exploration, visualization, and presentation experience. But how does it work and how to get started with it?
Solution
Power View is a new tool for intuitive ad hoc reporting which provides an interactive data exploration, visualization, and presentation experience to the business users. Business users can quickly and easily create and interact with different views of data from different angles. Power View reports can be based on data models on PowerPivot workbooks or tabular models or multi dimensional models (this requires installation of SQL Server 2012 Service Pack 1 Cumulative Update 4) deployed to SQL Server 2012 Analysis Services (SSAS) instances.
Power view was first introduced in SQL Server 2012 as Reporting Services Add-in for SharePoint 2010 and 2013 (enterprise edition) as thin browser-based Silverlight application which worked on data models based on PowerPivot workbooks or tabular models deployed to SQL Server 2012 Analysis Services (SSAS) instances. Though now, with the release of SQL Server 2012 Service Pack 1 Cumulative Update 4 (adds native support of Data Analysis Expressions (DAX) queries in Analysis Services Multidimensional Models), you can create Power View reports based on multi dimensional models (cube) as well. You can find more detail here.
You can also create Power View reports in Excel 2013 (available in Office Professional Plus and Office 365 Professional Plus editions) if you don't have or don't want to use SharePoint. I am going to demonstrate creating Power View reports in Excel 2013 in my next tip. You can learn about this here.
To learn about the system requirement click here and here.
Setting up SharePoint farm
You first need to active the "PowerPivot Integration Feature" by going to SharePoint Central Administration -> Manage farm features and clicking on Active as shown below:

Creating a site based on Business Intelligence Center template
If you have a site already created you can skip this step or else please create a site using "Business Intelligence Center" template as shown below. If you are creating a site in SharePoint 2013, you will have an option to chose the user experience of SharePoint 2010 or SharePoint 2013.
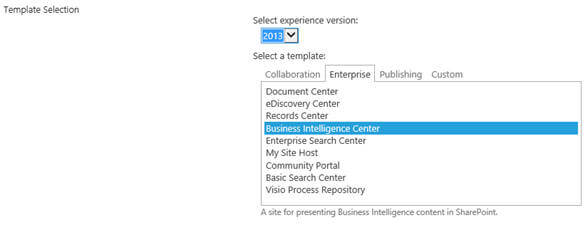
Please note, I am using SharePoint 2013 for demo and hence user experience might be slightly different if you are using SharePoint 2010.
Getting started with Power View Reports
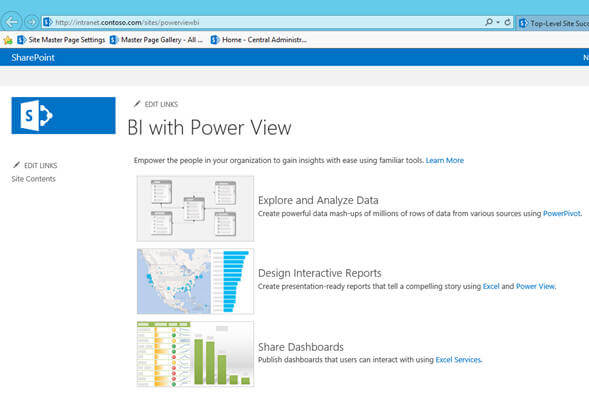
Now open your site in the Internet Explorer and it should look like this. If you have site in SharePoint 2010, it will have slightly different look.
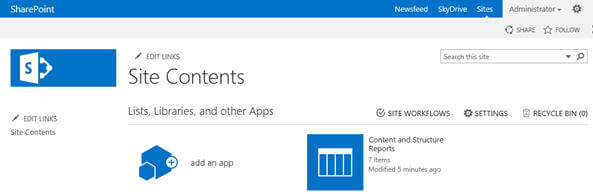
Click on the Site Contents link available on the left side and then click on SETTINGS link available on the right side.
On the site settings page, under Site Collection Administration group click on the Site Collection features as shown below:
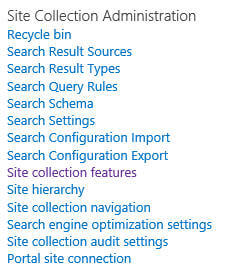
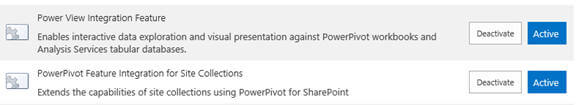
Ensure you have "Power View Integration Feature" and "PowerPivot Feature integration for Site Collections" features activated, if not please activate it.
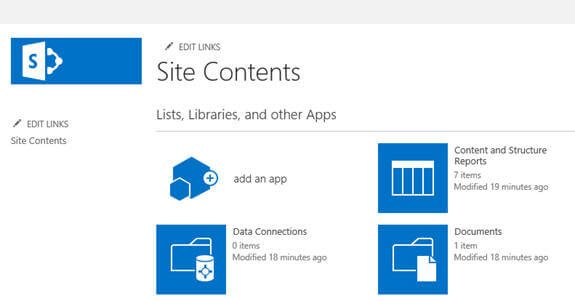
Now we need to add a PowerPivot Gallery document library. Click on "add an app" link as shown below:
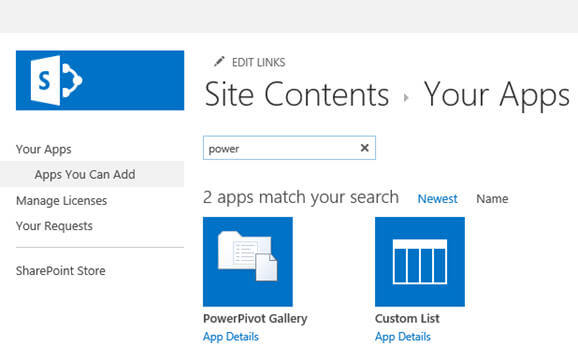
Enter Power in the search box and search for it. You will notice PowerPivot Gallery library template as shown below as part of the search result. Click on the PowerPivot Gallery link to add the PowerPivot Gallery library.
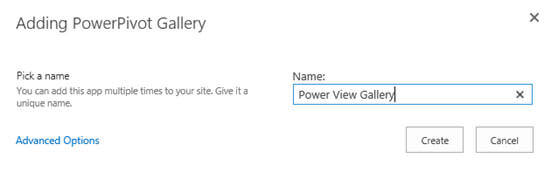
On the next screen you need to specify the name for the PowerPivot Gallery that you want to create as shown below. In my case I have named it Power View Gallery and click on Create button to create it.
Now if you click on the Site Contents link again you will notice newly created library (I named it "Power View Gallery") as shown below. Click on it to open the newly created library.
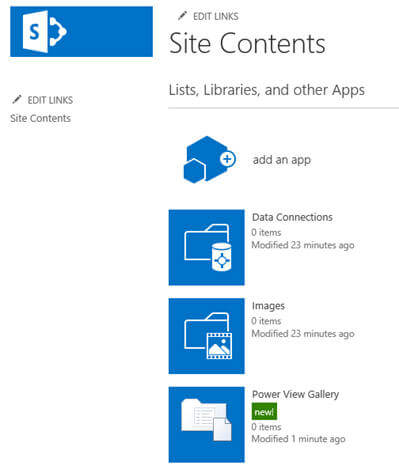
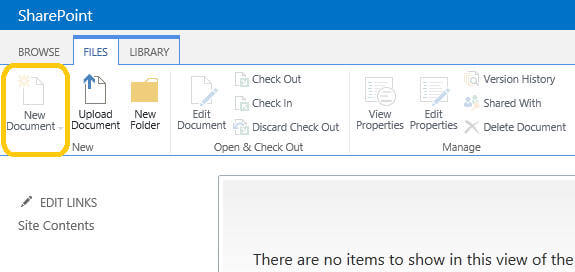
Once you have library open, you can go to FILES as shown below and you will notice New Document option is disabled. In order to enable it, follow the next step:
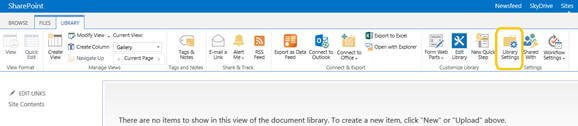
Now click on the LIBRARY on the ribbon and then click on the "Library Settings" icon\link on the right side as highlighted below:
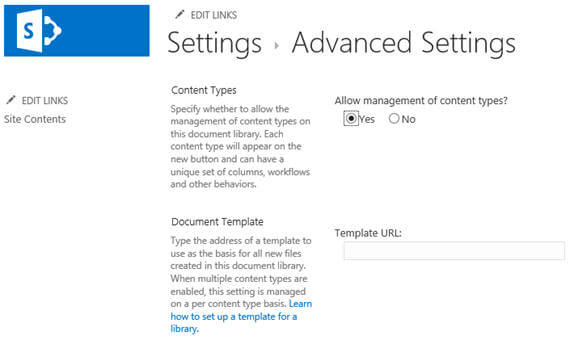
On the library settings page, click on the Advance Settings link and then on the Advance Settings page check "Allow management of content types" to Yes as shown below and save it.
Now if you go back to library and look under FILES ribbon as shown below you will notice "New Document" link is enabled but it allows to create PowerPivot Gallery document only.
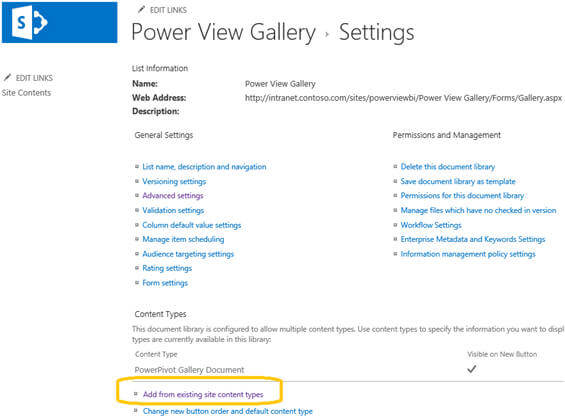
You need to add content types in order to create Power View reports. Go to Library settings again and click on "Add from existing site content types" as shown below:
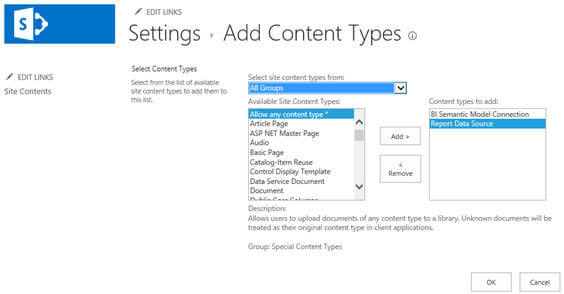
On the Add Content Types page, select "BI Semantic Model Connection" and "Report Data Source" and click on Add to add them. Click in Ok the save the settings.
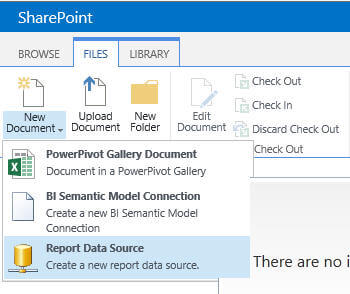
Now if you go again to the library you will notice that it allows you to create a "PowerPivot Gallery Document", "BI Semantic Model Connection" and "Report Data Source" under New Document menu as shown below:
If you want to create Power View reports based on tabular model you need to create BI Semantic Model connection and if you want to create Power View reports based on multi dimensional models (cubes) you need to create Report Data Source as shown below. Please remember you need to create shared Report Data Source (RSDS file) for connecting to multi-dimensional cube. The connection string for the Report Data Source should look like this Data Source=;Initial Catalog=;Cube='.
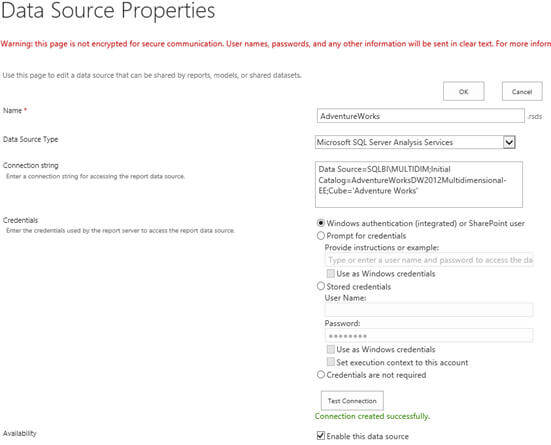
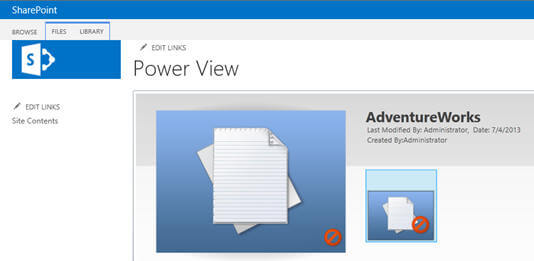
Once connection created, you can open the gallery (we named it Power View as above) that we created and you will notice the connection as shown below. You can click on this connection to create reports based on this connection.
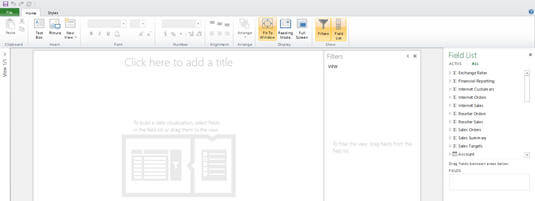
This is how the Power View report designer will look. You can find the field list on the based on the connection it is based on and you can design report the way you want from now on.
In this article, I talked about how you can configure to get started with creating Power View reports and my next tip I am going to demonstrate how you can create different types of reports in Power View based on the connection we created.
Next Steps
- Review Understanding the SQL Server 2012 BI Semantic Model (BISM) tip.
- Review Getting started with Tabular Model in SQL Server 2012 tip.
- Review my previous tips.


About the author
 Arshad Ali is a SQL and BI Developer focusing on Data Warehousing projects for Microsoft.
This author pledges the content of this article is based on professional experience and not AI generated.
View all my tips
