By: Scott Murray | Comments (4) | Related: > Power BI
Problem
What is the difference between Power BI Desktop and Power BI Online? What are the main areas of for Power BI Online? What data visualization options are available?
Solution
Microsoft continues to rapidly develop and deploy tools within the Power BI application stack. Of course there is the Power Query and Power Pivot tools in Excel. Furthermore, in a previous tip, Getting Started with Power BI Desktop, we described in detail the new Power BI Desktop (AKA Power BI Designer or PBID) that Microsoft has added to the Power BI tool set. That tip was followed by a second tip which reviewed some of the query methods available in Power BI Desktop. Finally, we provided a great tip on extracting data from a website. All these tips center around using the Power BI Desktop, but you can actually perform many similar functions using the Power BI website, https://powerbi.microsoft.com/en-us/.
Using Power BI Online
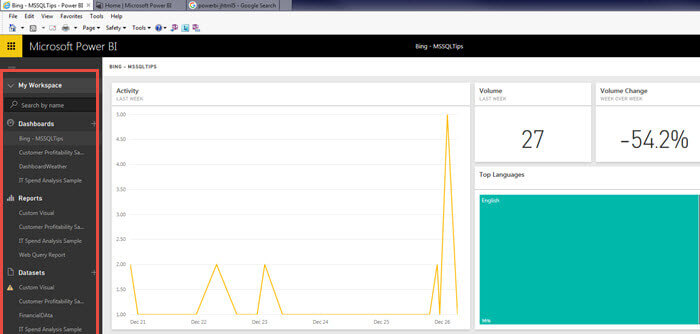
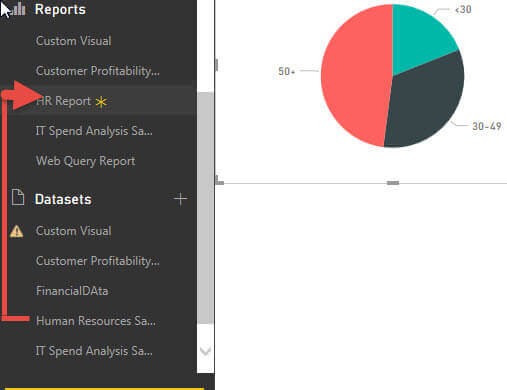
The Power BI website is in fact constructed upon and secured by the Windows Azure Cloud platform, and thus has a robust under pinning for supporting such things as HTML5 via what is called PowerView. You will notice, in the below screen print, down the left side of the site is listed "My Workspace". This area is the navigation map for interacting with Power BI Online and contains 3 main areas: Dashboards, Reports, and Datasets, which we will go over throughout this tip.
I actually found it a bit confusing at first trying to determine the difference between a report, a dashboard, and a dataset. However, after working with them for a few iterations of testing, they eventually made more sense. We will start at the most basic concept which is a dataset.
Similar to a dataset in SSRS, a Power BI dataset is source of data that can be used as the data basis for the other items in Power BI. Datasets can be static or dynamic; static datasets do not necessarily "refresh" automatically while many dynamic datasets can and will auto refresh based on a schedule that either you set up or which is set at a default refresh rate. The range of datasets available to Power BI online include:
- Uploaded Excel, CSV, or Power BI Desktop files.
- Linked Excel, CSV, or Power BI Desktop files residing on OneDrive for Business or OneDrive Personal.
- Data available in your organization's content packs. Content packs are "pre packaged" dashboards, datasets, and reports specific to your organization and are only available in Power BI Pro.
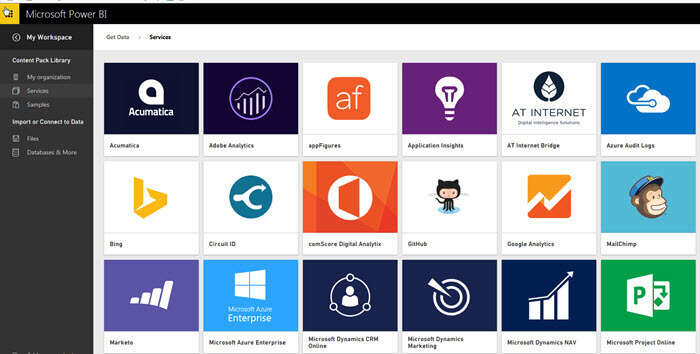
- Data from other online services content packs; these services range from Bing to GitHub to MailChimp to SalesForce.
- Data from SQL Azure Databases and Data Warehouses is also available, but it is also only available to Power BI Pro subscribers.
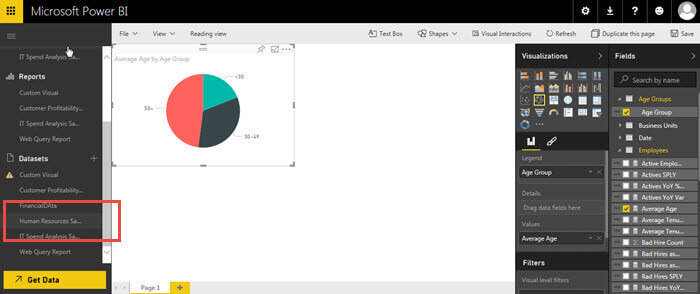
Once you connect to a dataset, you actually can jump right into designing a new visualization. For instance as shown below, I loaded the Human Resources sample dataset.
Immediately, you can begin to create a new visualization and add data points from this dataset.
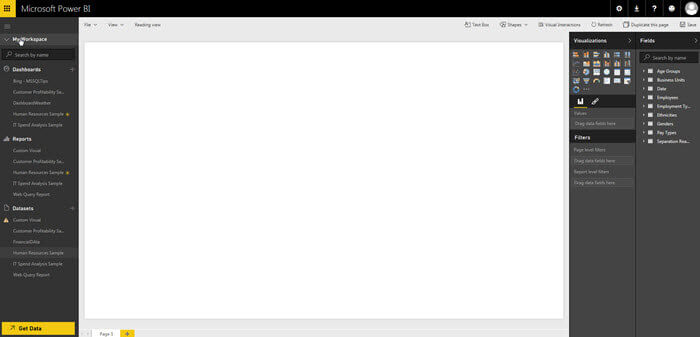
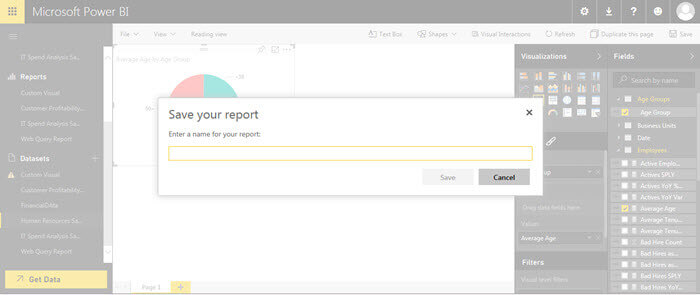
Subsequently, you can save the new visualization as a new report which leads us to our next main component on Power BI Online, a report. A report is a collection of pages that contain visualizations; thus a single report can have many pages of visualizations. You can create a report by two methods. The first method, shown below, takes the dataset visualizations that were created from the dataset and saves them as a report. In essence the dataset design grid is really a report that has not been saved. The second methods is to simply create a blank report using the "+" button next to Reports.
A report has two views, reading view, which does not allow change to formatting or sizes. However, reading view does allow the application of filters and offers the ability to highlight specific items when selected.
To the contrary, just like in Power BI Desktop, once the report has been saved and is in Edit Mode, you can adjust the visualizations' sizing, formatting and colors, legend, series, and data values. You can also apply advanced filtering, display ratios, and add new pages to the report, reorder pages, or delete existing pages. The big caveat is you must have created the report or be an owner of the report in order to open a report in edit mode.

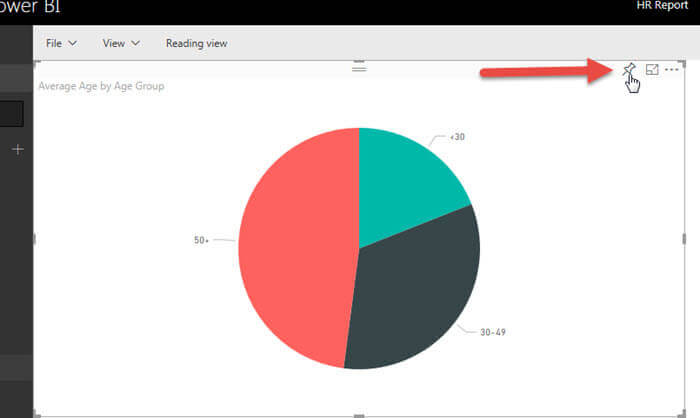
Finally from any report, you can pin a visualization tile from the report onto a Dashboard, which is the last main component of Power BI Online. A dashboard is a collection of tiles that have been pinned from various sources and do not have to come from the same dataset. A tile could be pinned from a report, but can also be pinned from SSRS or from Q & A session of a report (another tip will be forthcoming on the Q & A functionality).
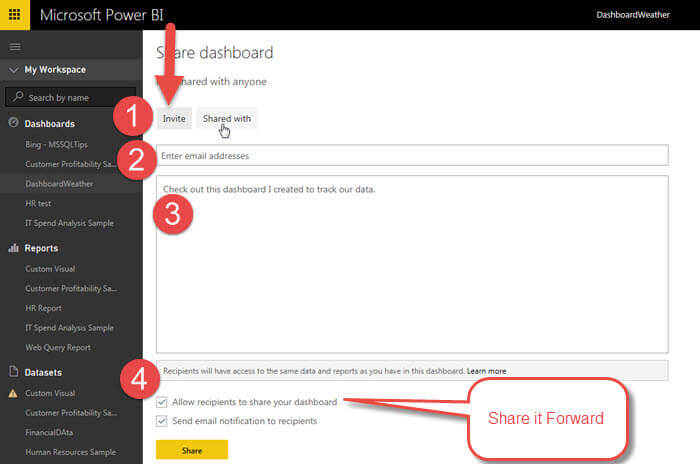
Furthermore, Dashboards can be shared with other Power BI users as illustrated next; however shared dashboards are read only. Even so, a person who has received a shared dashboard, can actually "share it forward" to another user, by checking "Allow recipients to share your dashboard" option.
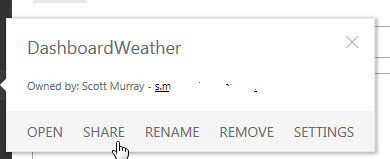
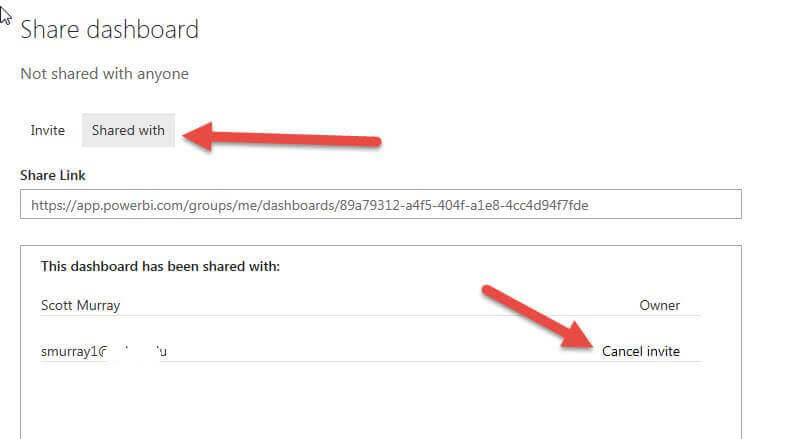
Both the sharing invitation and the "sharing it forward" option can actually be revoked, if desired, by selecting the "Shared with" option for the dashboard and either canceling the invitation, displayed below, or by removing the sharing forward option. Additionally, although tiles can be pinned from reading mode, only if you are owner of the Dashboard will the tile be permanently added to a dashboard.
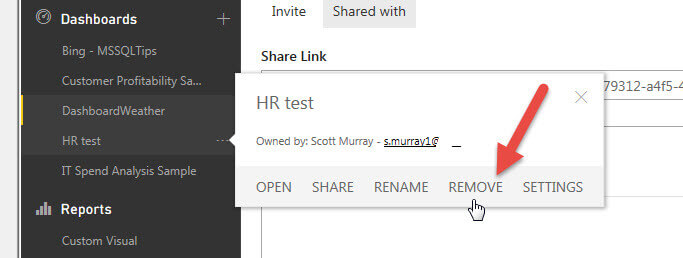
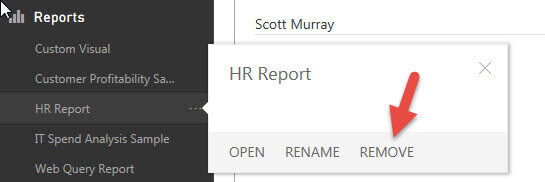
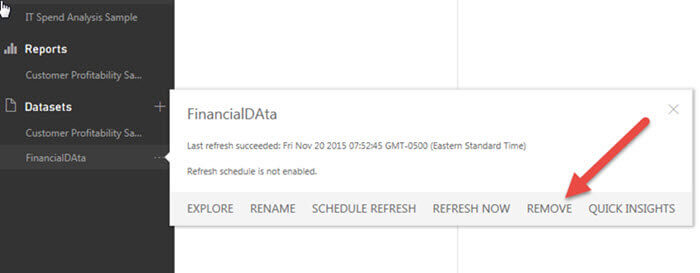
Of
course, any dataset, dashboard, or report can be removed from the
navigation pane. You should note that if you delete a dataset, any
related reports are also deleted. Although any related dashboards are
not deleted, the embedded visuals based on the deleted dataset are
removed from the dashboard. Thus, you need to be very careful about
deleting a dataset.
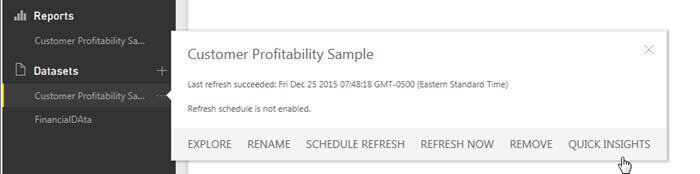
A last item about Online datasets that adds a neat touch is the Quick Insights tool, shown below. This tool examines the data in your dataset and creates a set of comparative visualizations that Power BI thinks may be helpful.
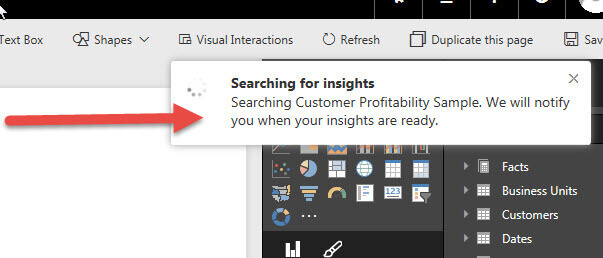
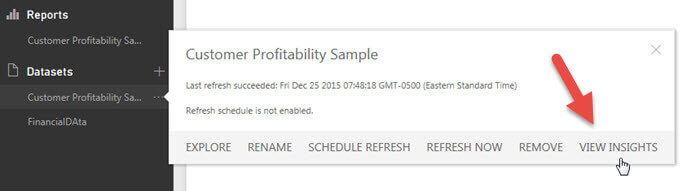
The process takes a few seconds to several
minutes depending on the size of your dataset, but once done the Quick
Insights option will change to "View Insights" as illustrated below.
The resulting insights, shown next, are based
on the dataset used; the insight calculator makes use of a set of
statistical algorithms looking for specific patterns such as time based
trends, outlier identification and analysis, and correlations.
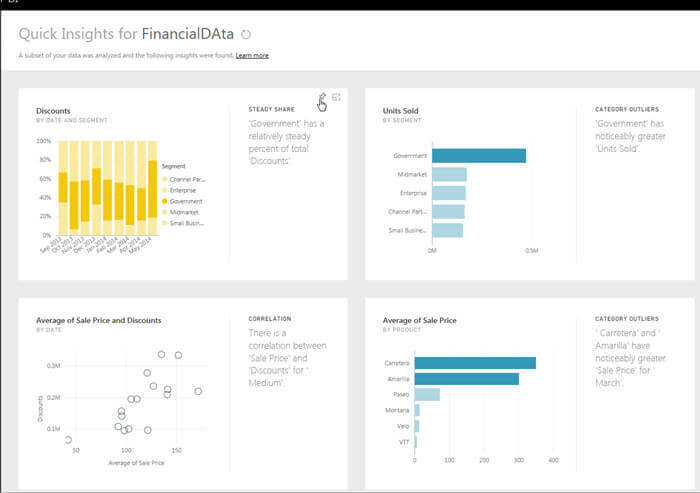
These insights can then be pinned to a dashboard for easy display.
Conclusion
This tip continues our review of the ever expanding Power BI toolset and specifically covered some of the ways to interact with Power BI online. Your own Power BI site contains 3 main components: datasets, dashboards, and reports. The dataset components is the "connector" to your data; these connections can include, but are not limited to: local files that are uploaded to Power BI, files on OneDrive, data in third party services, and data within the Azure Cloud. Once you have the dataset created, you can add visualizations, based on the dataset to a report page. Reports can have multiple pages and many visualizations. Finally, the visualizations from a report can be pinned, individually or as an entire report set, to a Dashboard as tiles. The dashboard can contain tiles from many sources and reports. Finally, all three components can be removed from your site, although removing a dataset actually removes any visualizations from related dashboard and deletes related reports entirely.
Next Steps
- Check out these related resources:
Learn more about Power BI in this 3 hour training course.


About the author
 Scott Murray has a passion for crafting BI Solutions with SharePoint, SSAS, OLAP and SSRS.
This author pledges the content of this article is based on professional experience and not AI generated.
View all my tips
