By: Siddharth Mehta | Comments (1) | Related: > Power BI
Problem
Power BI supports a large variety of connectors to data sources. It also supports a powerful query editor for editing a data model as well as data. But it does not have a library of functions for data science, statistics, NLP and many other areas. This means that while the data ingestion mechanism is very powerful, the data transformation will be limited to Excel like data editing in the absence of these data processing libraries, which is generally used by all data stewards, data scientists and expert data practitioners. These libraries are available with two of the most popular programming languages used for data science – R and Python. In this tip we will learn how to use R and Python to transform the data in Power BI and to enhance the Power BI data transformation capabilities.
Solution
The Power BI Query Editor supports execution of R and Python scripts to transform data. We need a few things in place before we can get started with the below exercises. First, we need to have SQL Server 2017 or higher installed on the development machine, with R and Python stack installed as part of SQL Server installation. We need a sample data that we can use to apply R and Python scripts. One such sample can be downloaded from here, or you can use any data accessible to you. Finally, we need Power BI installed on the development machine where you have access to the SQL Server sample data. Once all this is in place, we can start the below steps.
Transforming Data in Power BI with R and Python Scripts Example
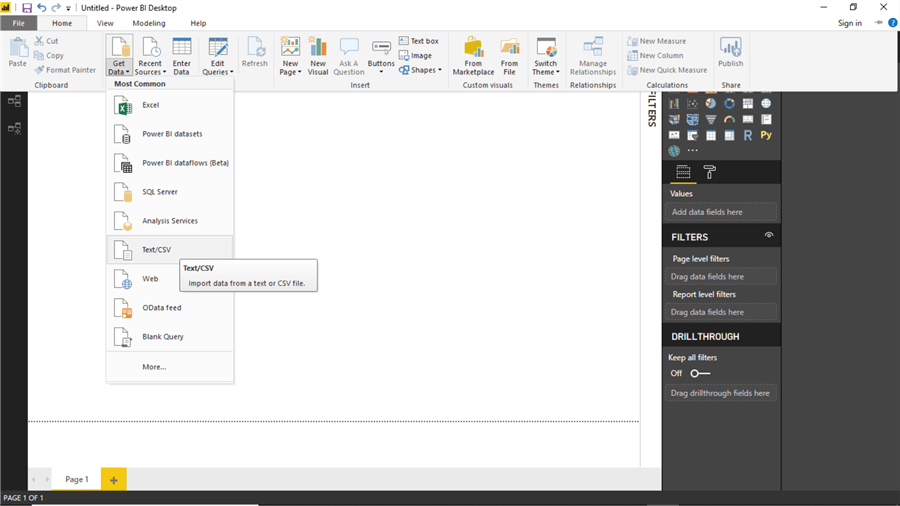
Open Power BI and click on the Get Data menu and select the appropriate data source. In this case, we have a CSV file, so we will select this as shown below.
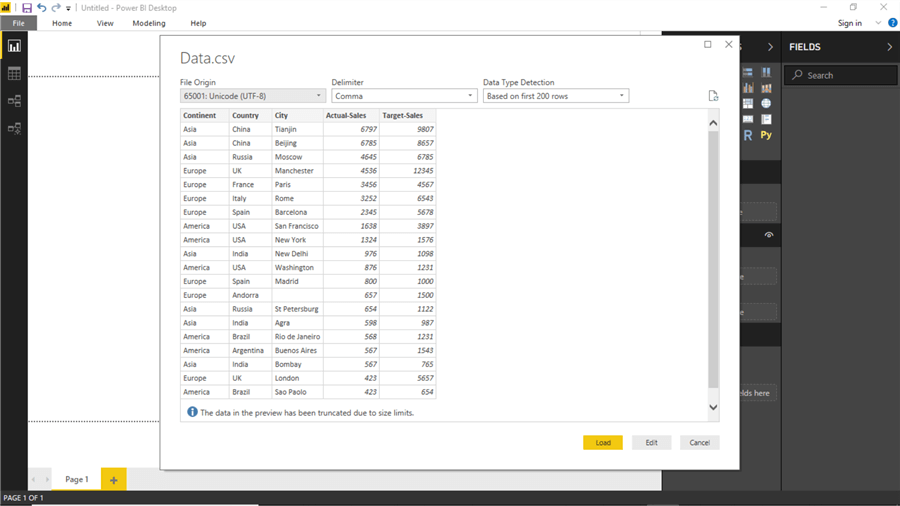
Select the file which contains the data, and then you will be able to preview the data as shown below.
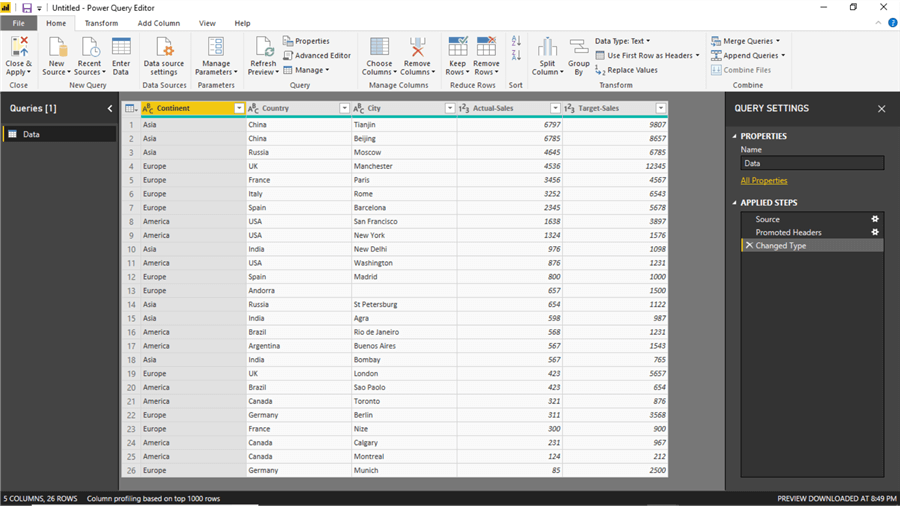
Click on the Edit button, which will take you to the Power BI Query Editor as shown below. Here you can see that there are five fields and the data-type of each filed is shown in the column header.
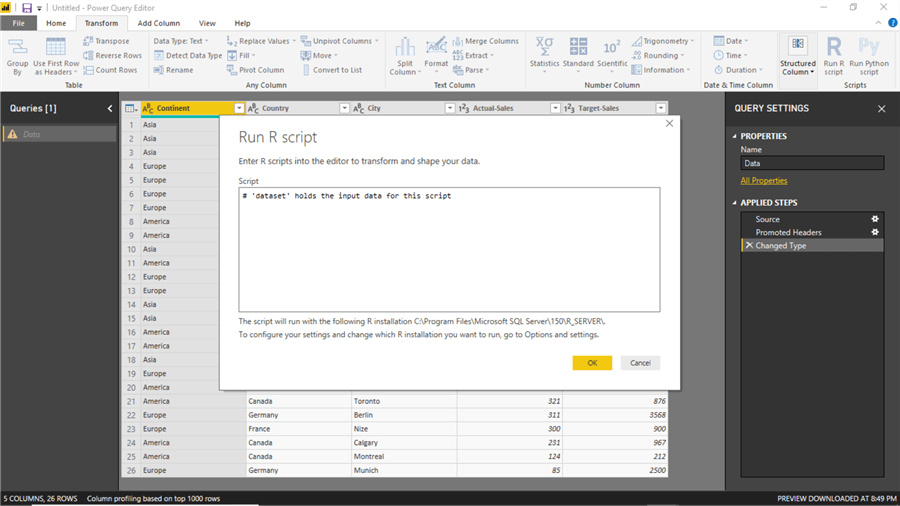
As you can see there are several options to shape and process data / data model. Let's say that we are a R / Python developer and we want to use the programming language of our choice to shape this data. We are going to use a very simple script to create a calculated column to demonstrate how R / Python can be used to achieve that. In real-life scenarios, developers would use highly complex data science related functions from powerful data processing libraries. The idea here is to show how R and Python libraries can be brought to use. Click on the Transform tab, and on the far right you will be able to see the Run R Script and Run Python Script buttons, which allows us to execute R and Python scripts as shown below.

Running an R Script in Power BI
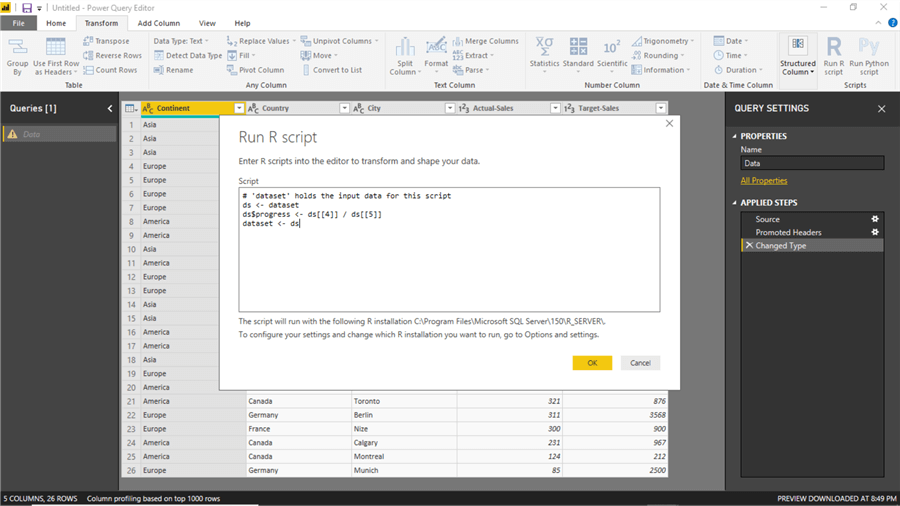
Let's start with a R script to shape this data. Consider this scenario that we want to calculate the progress percentage of sales, which can be calculated by dividing actual sales with target sales. Click on the Run R Script button to write a R script that can create this calculated field.
Copy the below R Script and paste it into the script window. In this script, the dataset is the default data frame that contains all the data fields that have been imported from the data source. In the first line of code we are assigning the data frame to a new data frame named ds. We are creating a new field named progress in the ds data frame ds and assigning it a calculated value of actual sales / divided by target sales, which is contained in fields number 4 and 5. Finally we are assigning this new data frame back to the default data frame dataset, to send the modifications in the output. If you read the dialog box carefully, you can read that the path of the R installation directory is specified, and that same would be used to execute the R scripts that you submit in this dialog box. In case if you are considering using any libraries, you would be required to install it on the R installation specified here, and then refer to them in your scripts.
ds <- dataset

ds$progress <- ds[[4]] / ds[[5]]

dataset <- ds
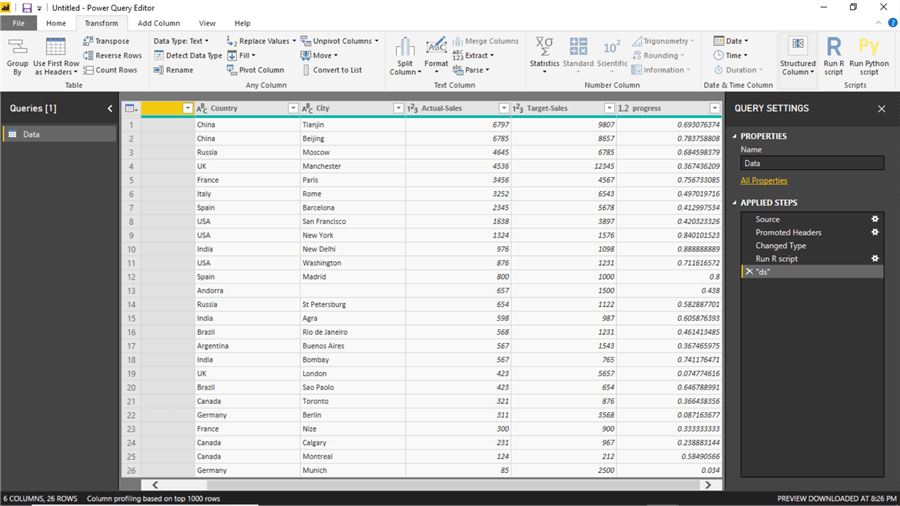
Now that our script is ready, click on the OK button. Now you will be able to see a new dataset named ds getting created. You will be able to see the calculated field progress on the right-most side with values calculated based on the formula we provided. This means that we have been able to successfully transform the data as well as the data model that is going to get loaded into Power BI using our R script.
Running a Python Script in Power BI
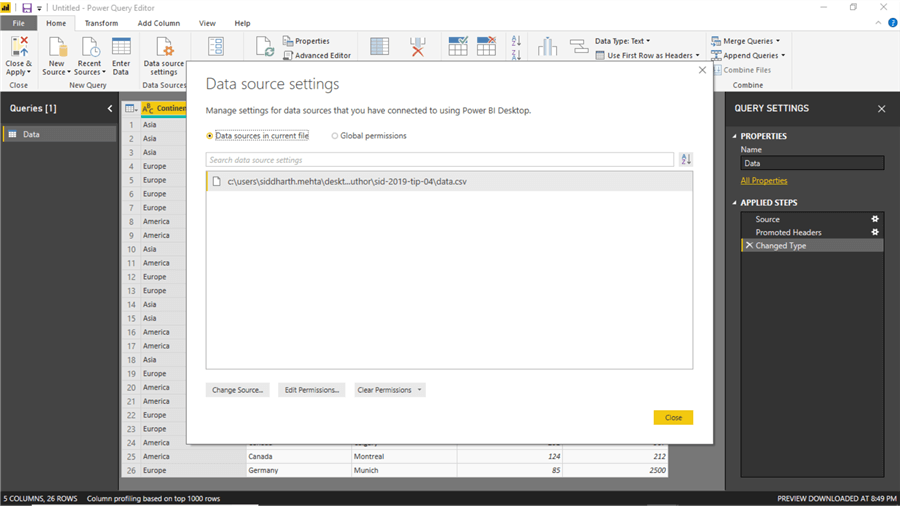
We want to test the Python scripts too to see how we can transform data using Python. So, cancel the R Script and ds step from the Applied Steps section, so that we can perform the same transformation on the original dataset using a Python script. Once you are back on the original dataset, click on Data Source Settings from the home menu as shown below.
Click on the Edit permission button and select the Privacy Level to be Public as shown below. To execute Python scripts in Power BI, the privacy level is required to be Public as of the draft of this tip.
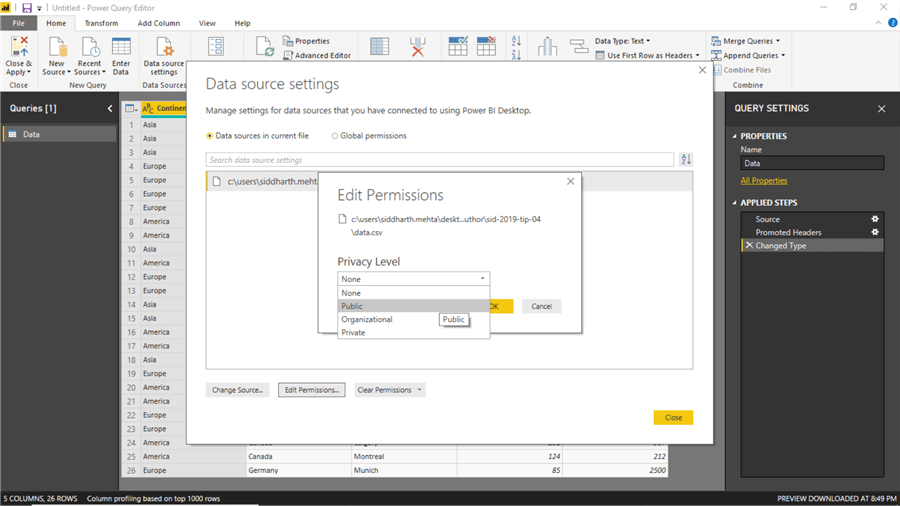
After selecting the Public Privacy level, click the OK button. Now click on Run Python Script to add the Python script to transform the data.
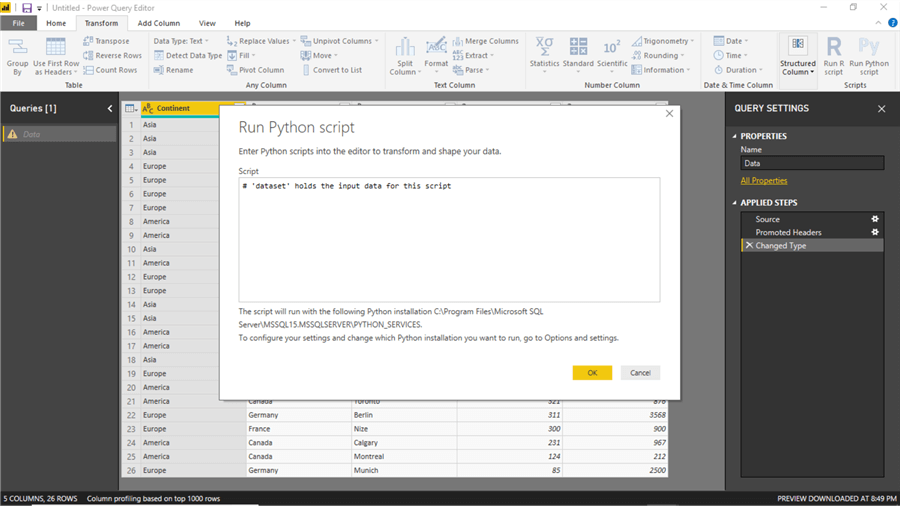
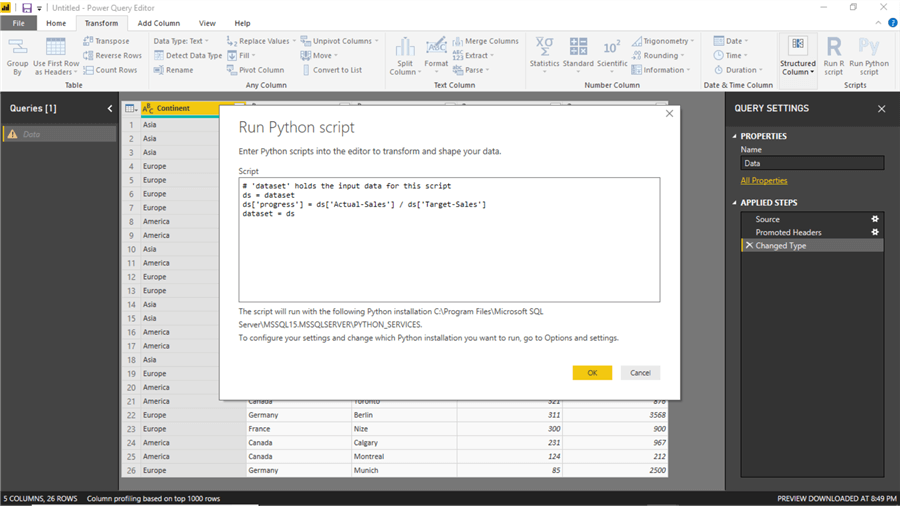
Add the below Python code which is the equivalent of the R code we executed earlier to create the progress calculated column. This dialog box will show you the path of the Python installation that is used to execute Python scripts, like the way it was showing the path for R scripts.
ds = dataset

ds['progress'] = ds['Actual-Sales'] / ds['Target-Sales']

dataset = ds
Now click on the Ok button and you will be able to see the output as shown below.
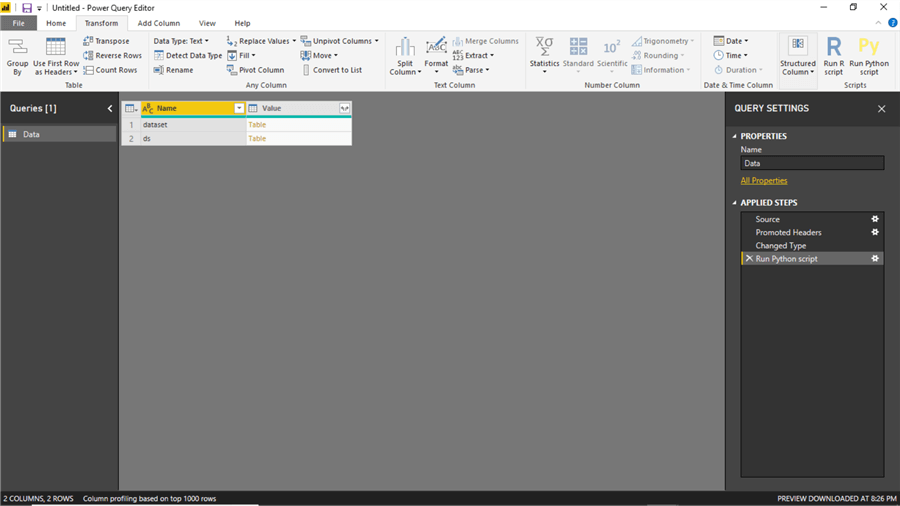
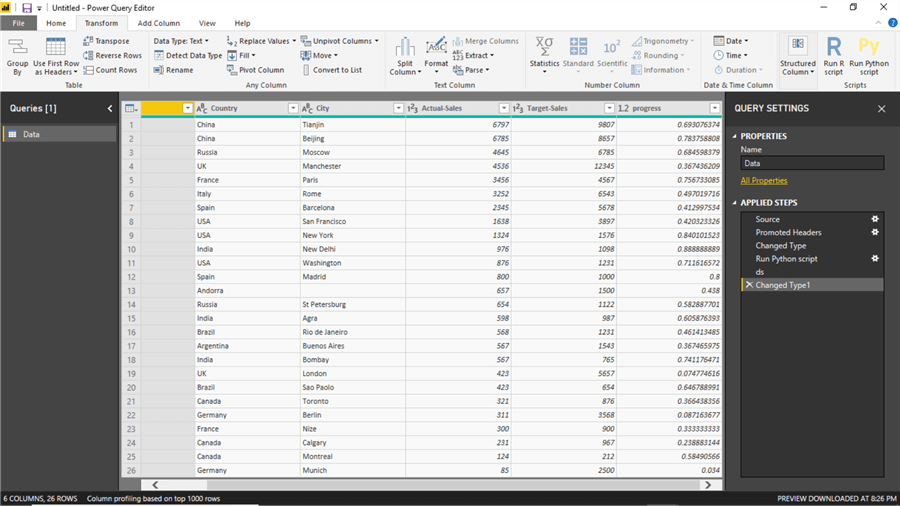
Click on the table link in record number 2 named ds, and you will be able to see the transformed dataset with the calculated field on the right, as shown below.
Using Transformed Data in Power BI Report
Now it's time to apply the changes to the data model and access this field in the Power BI Report. Navigate to the home menu and click on the Close and Apply menu item as shown below.
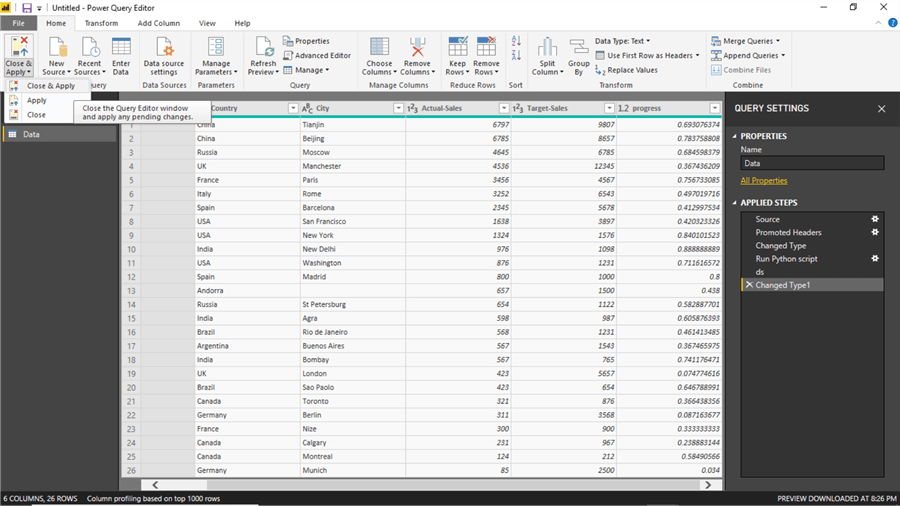
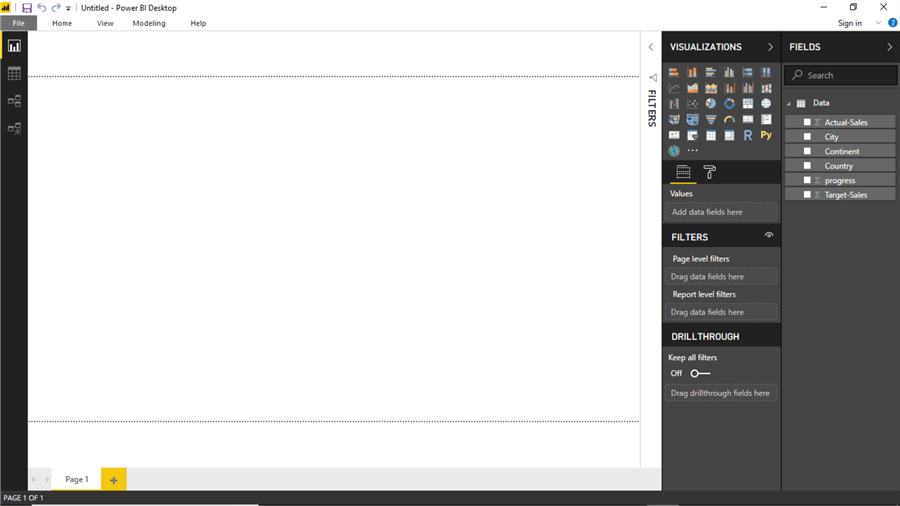
This will apply the transformation to the data model and load the model in the fields section, where you should be able to find the actual and the calculated field available for use in Power BI reports.
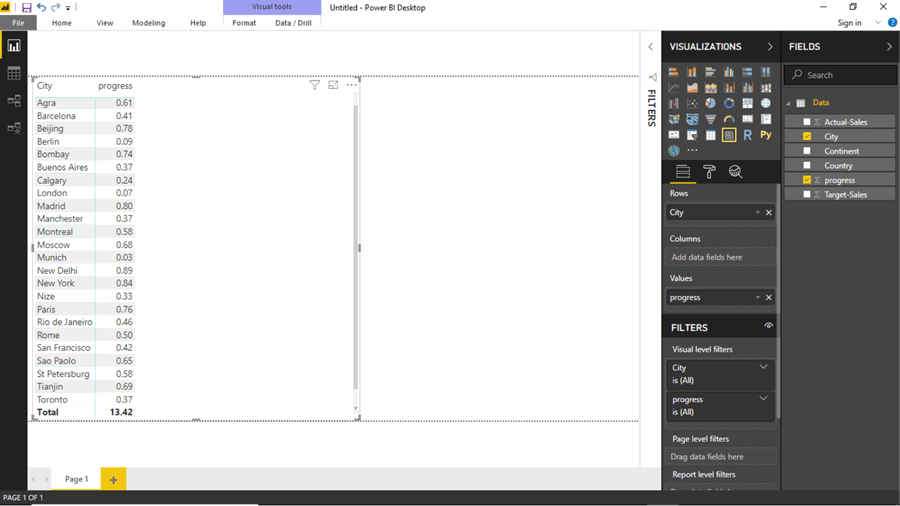
You can test the field by using it in any visualization to ensure that the calculated field is accessible to you, as shown below.
In this tip, we learned how to transform data in Power BI using R and Python by means of a simple example to establish the concept. Once you have learned this mechanism, the extent to which you can powerfully, easily and efficiently transform data depends on your R or Python programming skills.
Next Steps
- Consider applying machine learning algorithms or similar other data science techniques to directly infer predictive intelligence on your data before the actual data gets loaded in the Power BI Data model itself.
- Check out these resources:
Learn more about Power BI in this 3 hour training course.


About the author
 Siddharth Mehta is an Associate Manager with Accenture in the Avanade Division focusing on Business Intelligence.
This author pledges the content of this article is based on professional experience and not AI generated.
View all my tips
