By: Ben Richardson | Comments (2) | Related: > Azure
Problem
With the exponential increase in the data available for knowledge mining, a variety of machine learning algorithms have emerged. However, most of the existing machine learning algorithms have been implemented in high-level programming languages such as Python, Java, and C #. However, not everybody is familiar with these languages. Therefore, a platform is required where a person not proficient with programming can perform predictive analysis using easy-to-use drag and drop interface.
Solution
In this tip we will provide a brief introduction to Microsoft Azure Machine Learning (ML) which is a cloud platform for machine learning. We will see how to make an account on the Azure cloud platform. We will also explore basic Azure ML features and will finally end the article with a simple machine learning example with Azure.
Several companies have answered the call for the growing need for drag and drop, easy-to-use, cloud-based machine learning platforms. In this context, IBM Watson Machine Learning, Google Cloud Machine Learning Engine, Amazon Machine Learning Services, and Microsoft Azure Machine Learning are some of the most commonly used existing cloud-based machine learning services.
Microsoft Azure Machine Learning
In this article, we will focus on the Microsoft Azure Machine Learning Solution. Microsoft Azure ML is a simple-to-use, cloud-based, drag and drop machine learning platform where you can develop advanced machine learning model without writing a single piece of code.
In this tip, first, we will see how to make an account with Microsoft Azure ML. We will then see different features of Microsoft Azure ML and then finally we will see how to create a simple predictive analytics model with Azure ML.
Creating a Free Account with Azure Machine Learning
The first thing that you need to do is create an account with Microsoft Azure Machine Learning. To do so, you need to execute the following steps.
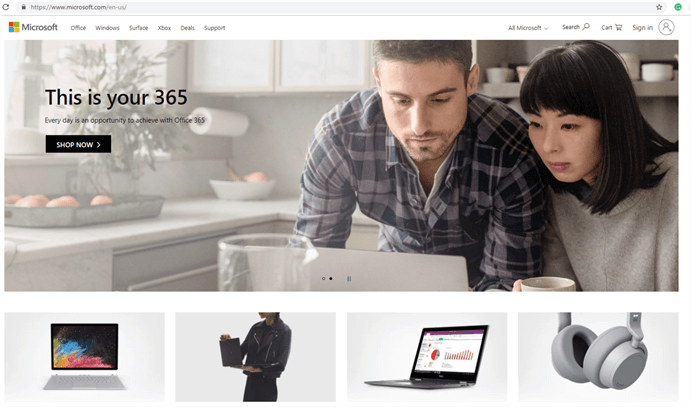
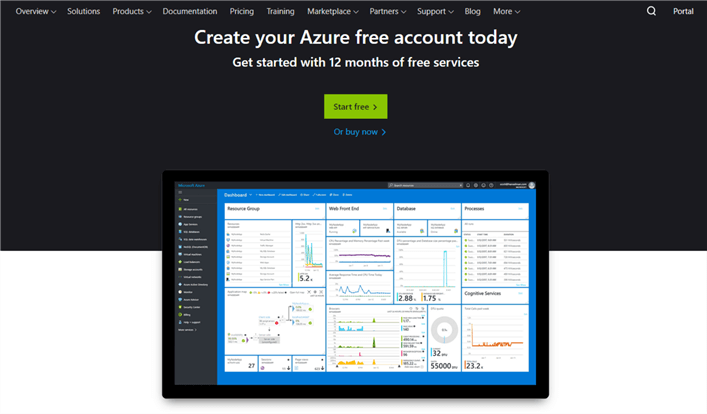
1 - Go to www.microsoft.com and click on the sign in button on the top right as shown below:
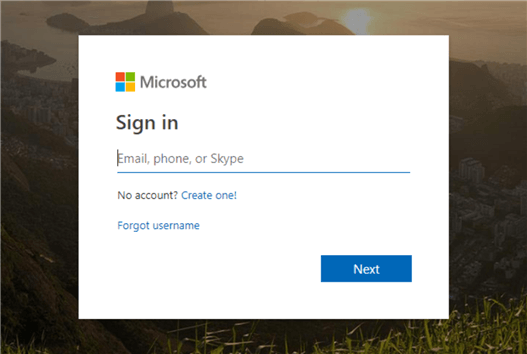
2 - Next, you need to sign in with your Microsoft Account. If you already have one, use that, else you can create a new account with Microsoft.
3 - Once you login to your Microsoft account, you should see the following page.
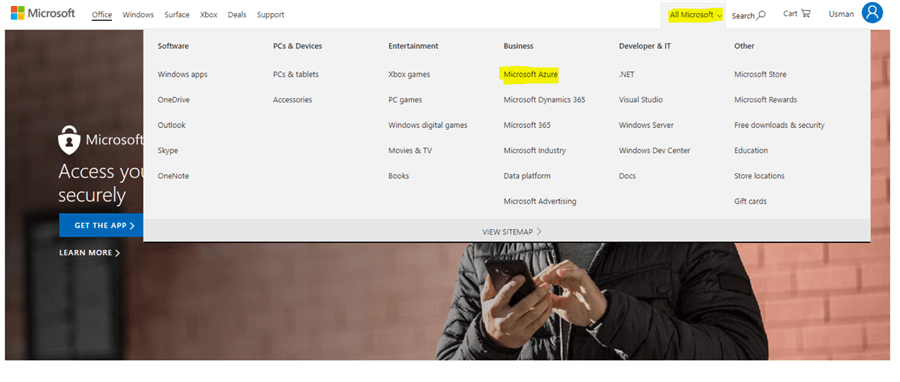
From the page above, click on the "All Microsoft" menu option at the top and then click on the "Microsoft Azure" option from the list of services.
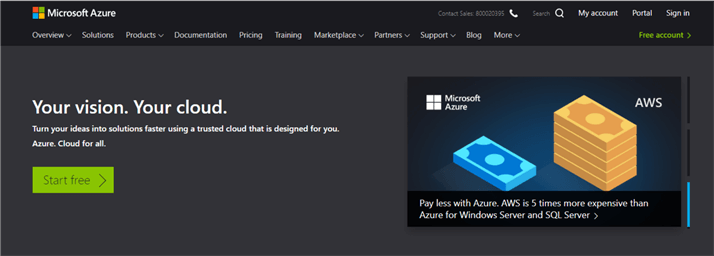
From the page that appears, click the "Start Free" button.
Next, click "Start Free" button from the page that appears.
You will be again prompted to Sign in to your Microsoft account.
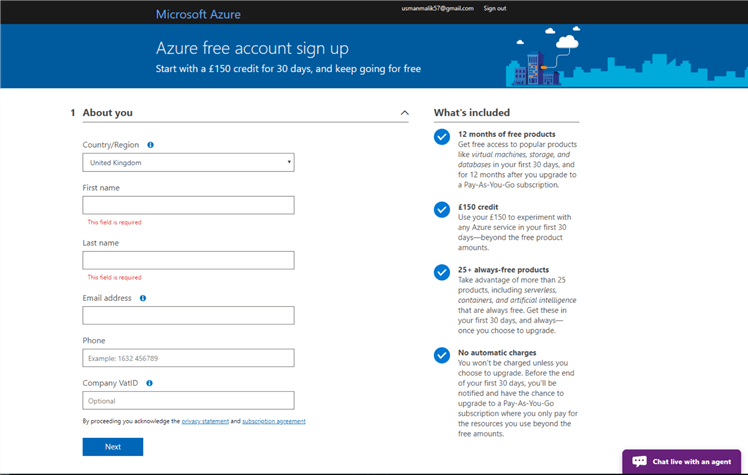
4 - You need to sing up for the Azure services before you can use them. To do so fill all the details required to use Azure ML Services. You will be required to provide your personal details along with the credit card information. Note that you don’t have to pay anything with your credit unless you upgrade your subscription.
Once you have provided all the details and accept the license agreement, you will be taken to the following page:
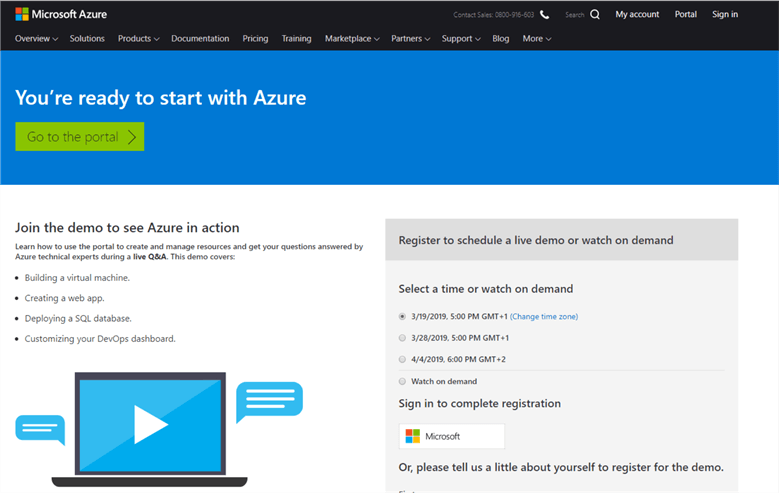
Here click on the "Go to the portal" page and you will be taken to the Azure ML dashboard.
Exploring Azure Machine Learning Features
In the last section, we saw how to sign up for Azure ML services. In this section, we will explore the silent features of Azure ML dashboard.
To access the Azure Machine Learning Studio, simply open the following URL: https://studio.azureml.net/.
You may need to sign in with your Microsoft account again if you signed out after creating your account in the last section. After you sign in, you should see the following page:
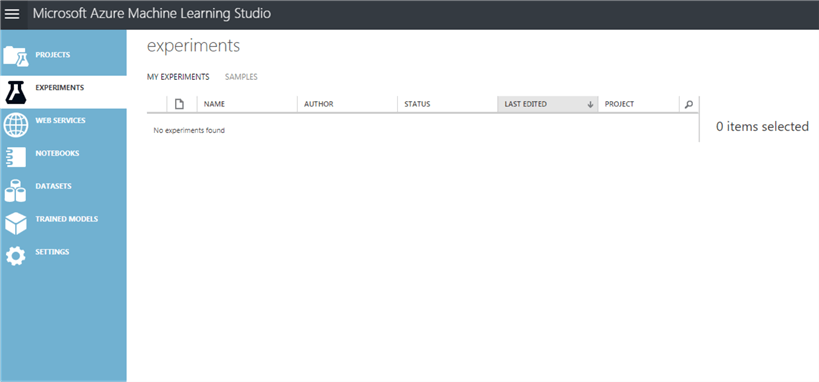
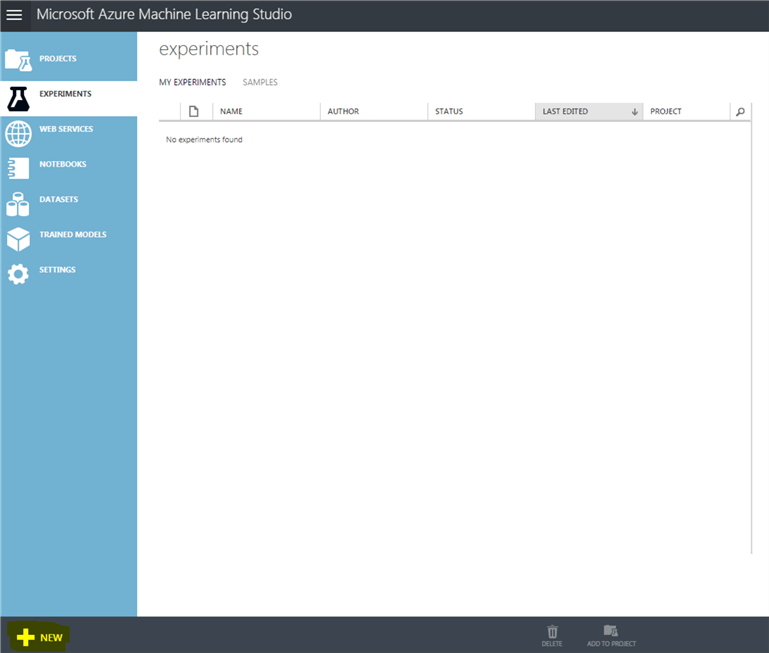
You can see main tabs on the left side of the Azure ML studio. These are the seven high-level components of Azure ML studio. Let’s briefly explain them.
Projects
- The project tab contains the overall information about all the experiments performed, datasets used and models trained and tested during a specific project.
Experiments
- The Experiments component is used to iteratively build, test and train your models. You can also edit a previously created model. It consists of simple drag and drop options that can be used to efficiently build your model.
Web Services
- Once a model is created as a result of an experiment, it can be deployed in the form of web service. The web service component allows the deployment of web service as a public as well as a private API.
Notebooks
- This component is used to execute your own Python scripts. The Notebook allows you to create Python scripts in the form of python notebook. It is basically a cloud alternative of Jupyter Notebook.
Datasets
- This component contains all the dataset that you upload for training and testing. It also contains variety of datasets by default that you can use for the benchmarking of your trained algorithms.
Trained Models
- Here you can find all the models that you trained previously. You can test the already trained models on new datasets if you want.
Settings
- The settings tab contains all the options related to Azure ML studio that you can modify. For instance, you can increase the memory size, the authorization tokens and authorize other users to access your dataset.
Azure Machine Learning for Classification Tasks
In this section, we will see how Azure ML can be used to perform classification. We will use Breast Cancer Dataset to create a classification model capable of predicting whether a tumor is malignant or benign depending upon different values.
Following are the steps required to be performed:
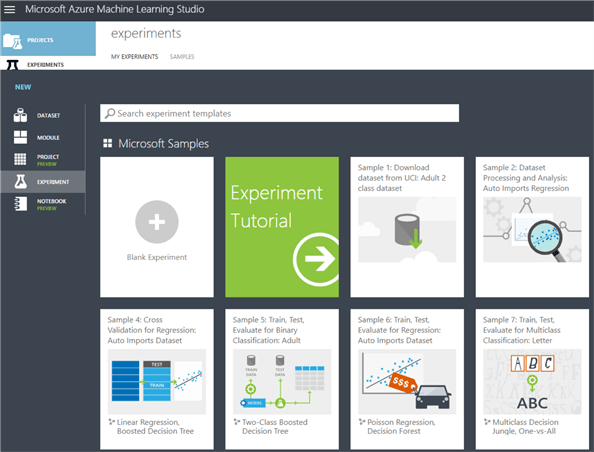
1 - Create a New Experiment by clicking on the "+NEW" button at the bottom of the page.
2 - From the page that appears, select "Blank Experiment".
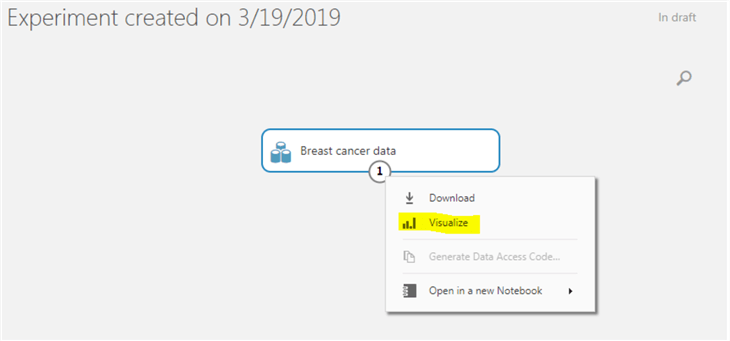
3 - From the page that appears, from the dataset samples on the left, drag the "Breast cancer data" and drop it on the experiment window on the right. This is the dataset we are going to use to train our classification model. Click on the dataset and then "Visualize" button to visualize the dataset as shown in the following screenshot:
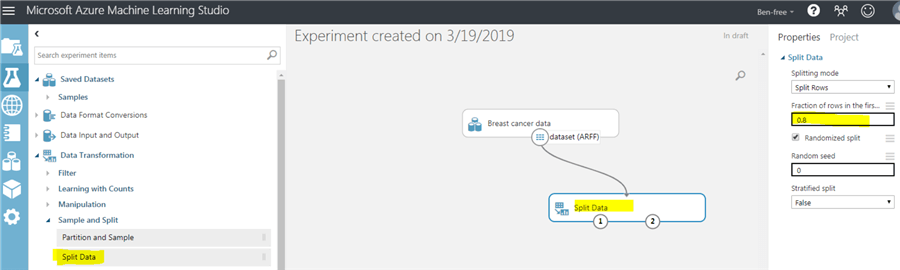
4 - Next from the Data Transformation -> Sample and Split option drag and drop "Split Data" module to the main window. Set value of 0.8 to the split data option which means that 80% of the data will be used to train the algorithm. Connect the dataset to the split data module.
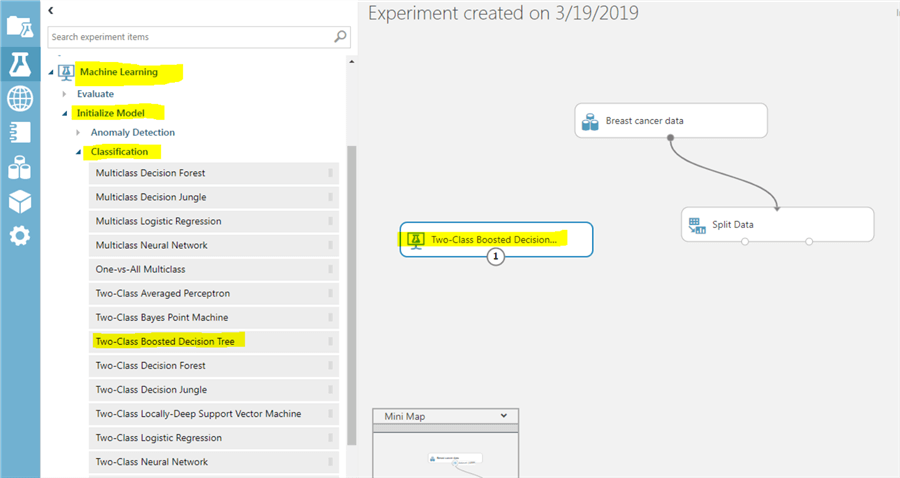
5 - Next, from the "Machine Learning -> Initialize Model -> Classification" category, select the "Two-Class Boosted Decision tree" and drop it on the experiment window as shown below:
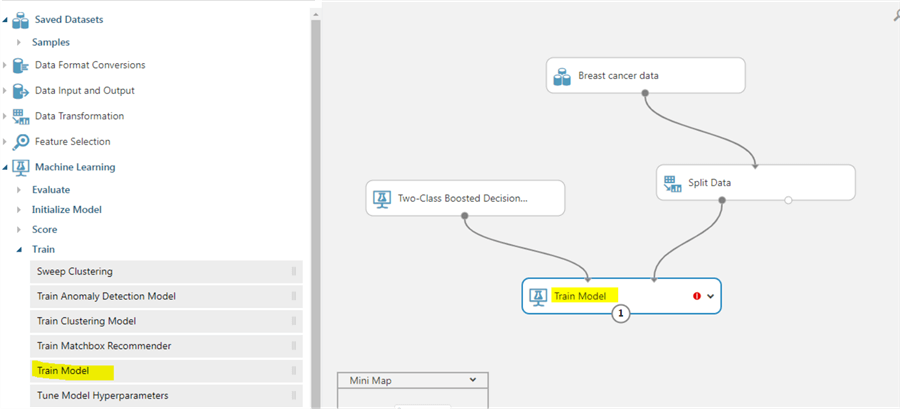
6 - From "Machine Learning -> Train" category, select the "Train Model" module and drop it to the experiment window. Connect both the "Split Data" and "Two-Class Boosted Decision Tree" modules to the Train Model.
7 - Click on "Train Model" module. Click on the "Launch column selector" window on the right. On the window that opens, select Class as the value since we want to predict the class of the tumor.
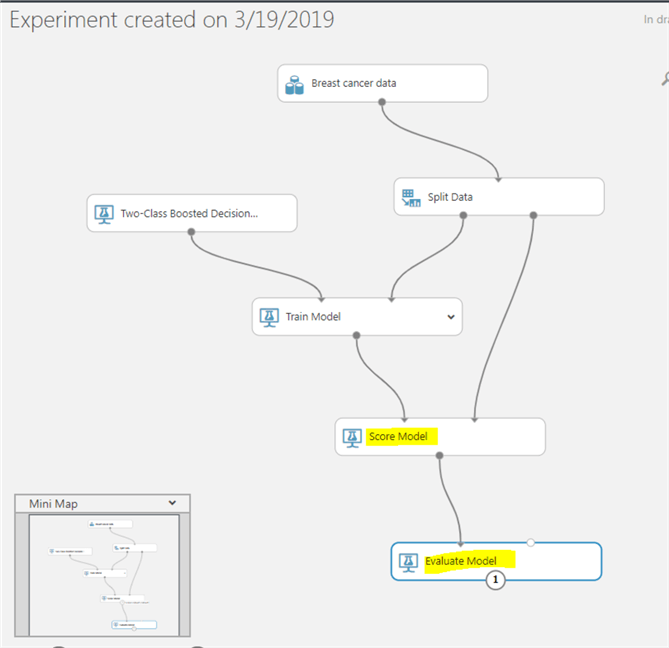
8 - From "Machine Learning -> Evaluate" select "Evaluate Model" module and add it to the experiment window. Similarly, from "Machine Learning -> Score" add "Score Model" module to the experiment window. Connect the "Split Data" module and the "Train Model" module to the "Score Model" model and then connect the "Score Model" module with the "Evaluate Model" module as shown below:
9 - The model is ready now. Click on "Save" button from the bottom and then click "Run" button. The model will be trained.
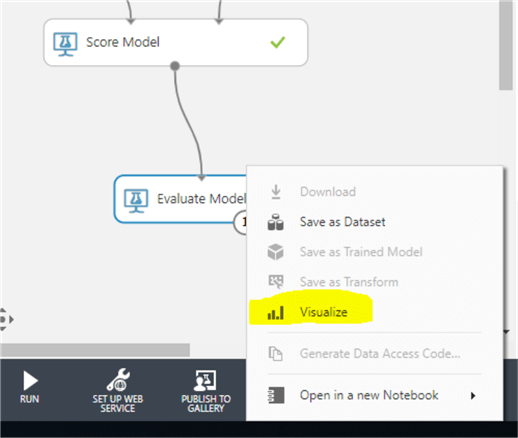
10 - Once the model is trained, hover the mouse on the "Evaluate Model" module and click on "Evaluation Results" and the "Visualize" from the options.
11- In the output, you should see the following results.
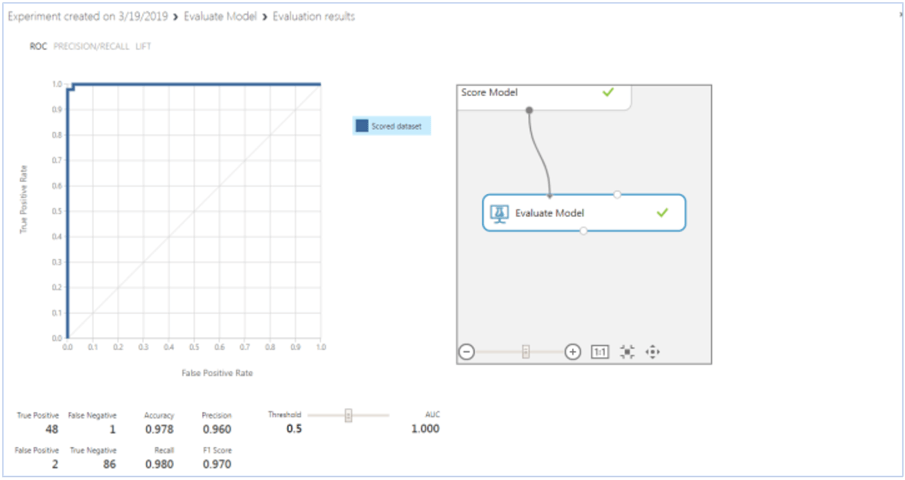
The accuracy of our model is 97.8% percent while the F1 score is 0.97. Out of 134 test samples, 131 were predicted correctly.
Resources
Next Steps
- Choose another data set from the Azure Machine Learning studio and try to first perform binary classification.
- Try to perform multiclass classification with another algorithm and see if you can get good results.
- Solve one of the regression problems using Azure ML.


About the author
 Ben Richardson is the owner of Acuity Training, a UK based IT training business offering SQL training up to advanced administration courses.
This author pledges the content of this article is based on professional experience and not AI generated.
View all my tips
