By: Koen Verbeeck | Comments (4) | Related: > Power BI Charts
Problem
I'm trying to create a chart in Power BI Desktop that shows me the employees that contribute the most to the overall sick days of the company. I'm struggling with the DAX formulas needed to create the measures. How can I solve this?
Solution
The Pareto principle – also known as the 80/20 rule – states that the majority of the effects come from a minority of causes. For example, 80% of the sales comes from 20% of the clients. In this case, we want to examine where the majority of sick days in the company come from just a handful of employees. The tip Plotting data on a secondary axis in SQL Server Reporting Services shows how you can create a Pareto analyses in SQL Server Reporting Services (SSRS).
Creating Test Data
Before we start, we need some test data first. Let's create a new database and a table with 10 fictional employees using the following script:
CREATE DATABASE Pareto;

CREATE TABLE dbo.DimEmployee(
     SK_Employee    INT IDENTITY(1,1) NOT NULL
    ,EmployeeID     INT NOT NULL
    ,EmployeeName   VARCHAR(100) NOT NULL
    ,DepartmentName VARCHAR(100) NOT NULL
);

WITH CTE_Employees AS
(
 SELECT EmployeeID = 1, EmployeeName = 'Employee1'   ,DepartmentName = 'Sales'
 UNION ALL
 SELECT EmployeeID = 2, EmployeeName = 'Employee2'   ,DepartmentName = 'Sales'
 UNION ALL
 SELECT EmployeeID = 3, EmployeeName = 'Employee3'   ,DepartmentName = 'Sales'
 UNION ALL
 SELECT EmployeeID = 4, EmployeeName = 'Employee4'   ,DepartmentName = 'Marketing'
 UNION ALL
 SELECT EmployeeID = 5, EmployeeName = 'Employee5'   ,DepartmentName = 'Marketing'
 UNION ALL
 SELECT EmployeeID = 6, EmployeeName = 'Employee6'   ,DepartmentName = 'IT'
 UNION ALL
 SELECT EmployeeID = 7, EmployeeName = 'Employee7'   ,DepartmentName = 'IT'
 UNION ALL
 SELECT EmployeeID = 8, EmployeeName = 'Employee8'   ,DepartmentName = 'Operations'
 UNION ALL
 SELECT EmployeeID = 9, EmployeeName = 'Employee9'   ,DepartmentName = 'Operations'
 UNION ALL
 SELECT EmployeeID = 10, EmployeeName = 'Employee10' ,DepartmentName = 'Operations'
)
INSERT INTO [dbo].[DimEmployee]
(
    [EmployeeID]
   ,[EmployeeName]
   ,[DepartmentName]
)
SELECT
     EmployeeID
    ,EmployeeName
    ,DepartmentName
FROM [CTE_Employees];
The dimension is created as a type 2 slowly changing dimension, having 2 attribute columns to support it: ValidFrom and ValidTo. We also need a date dimension. This script creates a very rudimentary date dimension, on the month level:
CREATE TABLE dbo.DimDate(
    SK_Date DATE NOT NULL,
    [Year] INT NOT NULL,
    [Month] INT NOT NULL,
    [YearMonth] INT NOT NULL
);

INSERT INTO dbo.DimDate
([SK_Date],[Year],[Month],[YearMonth])
VALUES
 ('2019-01-01',2019,1,201901)
,('2019-02-01',2019,2,201902)
,('2019-03-01',2019,3,201903)
,('2019-04-01',2019,4,201904)
,('2019-05-01',2019,5,201905)
,('2019-06-01',2019,6,201906)
,('2019-07-01',2019,7,201907)
,('2019-08-01',2019,8,201908)
,('2019-09-01',2019,9,201909)
,('2019-10-01',2019,10,201910)
,('2019-11-01',2019,11,201911)
,('2019-12-01',2019,12,201912);
And of course, we need a fact table containing the number of days an employee was sick in a given month. To keep things simple, the same numbers are repeated for each month:
WITH CTE_SickDays AS
(
    SELECT ID = 10, Cnt = 0
    UNION ALL
    SELECT ID = 2, Cnt = 0
    UNION ALL
    SELECT ID = 8, Cnt = 0
    UNION ALL
    SELECT ID = 7, Cnt = 1
    UNION ALL
    SELECT ID = 5, Cnt = 1
    UNION ALL
    SELECT ID = 3, Cnt = 5
    UNION ALL
    SELECT ID = 9, Cnt = 6
    UNION ALL
    SELECT ID = 1, Cnt = 10
    UNION ALL
    SELECT ID = 4, Cnt = 11
    UNION ALL
    SELECT ID = 6, Cnt = 15
)
SELECT
     e.[SK_Employee]
    ,d.[SK_Date]
    ,SickDays = s.[Cnt]
INTO dbo.Fact_SickDays
FROM [CTE_SickDays]         s
CROSS JOIN [dbo].[DimDate]  d
JOIN [dbo].[DimEmployee]    e ON    s.[ID] = e.[EmployeeID];
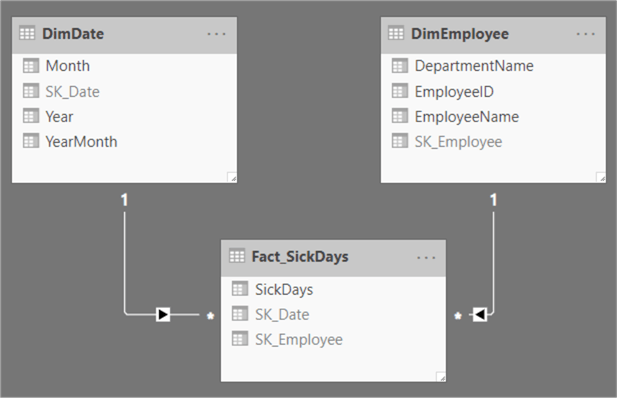
Now we're going to load this data into Power BI Desktop. The version used in this tip is the July 2019 edition. You can download the latest version here. The tip Querying SQL Server Data with Power BI Desktop gives a good overview on how you can do this. The final model looks like this:
Writing the DAX measures
Calculating the Pareto analysis will take multiple steps. The first one is to create an explicit measure calculating the number of sick days. Its DAX formula is straight forward:
# Sick Days = SUM(Fact_SickDays[SickDays])
It's a best practice to create explicit measures instead of using implicit measures. This way, you don't have to refer to a table column. Now we need to create a rank measure, where the employee with the highest number of sick days has number 1, the second employee number 2 and so on. The formula looks like this:
Sickness Rank =
IF(
    ISBLANK([# Sick Days]) || NOT HASONEVALUE(DimEmployee[EmployeeName])
        ,BLANK()
        ,RANKX(ALLSELECTED(DimEmployee),[# Sick Days],,0,Dense)
    )
The IF clause uses the ISBLANK and the HASONEVALUE functions to return blank values in some edge cases. If an employee has no sick days, no rank should be returned. If multiple employees are selected at the same time (for example in a grand total), there should be no rank either. The blog post How to use RANKX in DAX does a pretty good job at explaining the RANKX function.
The function ALLSELECTED is used to remove any context filter from the employee table. For example, let's create a table with the employees and the measures we've already created, filtered on the month of January:
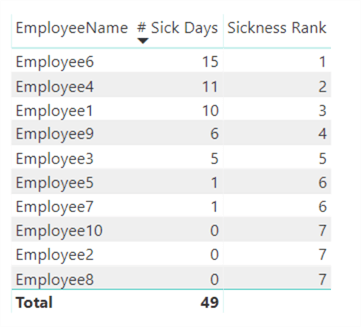
As you can see the rank function works. If we don't use ALLSELECTED, the function will return 1 for every row:

This is because the filter context of the rows will filter the employee table. For example, at row 1 we have Employee6. This row filters the employee dimension so that only data for this employee will be shown. However, when we calculate the rank, we will thus only see the data for employee6 so it will get rank 1. The same happens for each row. We want to "escape" the filter context and look at how the data for employee6 compares to all other employees. That's where ALLSELECTED comes into play.
If you don't want ties, you can use the special trick as explained in the Breaking Ties section of the How to use RANKX in DAX: you use a column that can be converted to an integer (such as the employee ID or the start date of the employee), divide it by a very large number and add it to the rank.
The next step is to write a running total. This corresponds to the cumulative distribution function of the Pareto distribution (albeit discrete). The formula is quite complex:
Sickness Running Total =
IF(
    ISBLANK([# Sick Days]|| NOT HASONEVALUE(DimEmployee[EmployeeID]))
        ,BLANK()
        ,VAR currank = [Sickness Rank]
        RETURN
         SUMX(FILTER(
                ALLSELECTED(DimEmployee),
                [Sickness Rank] <= currank)
            ,[# Sick Days])

)
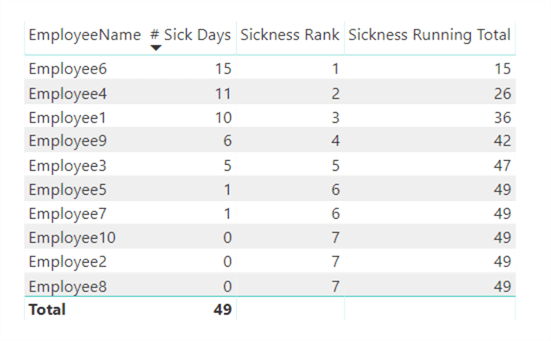
It returns the following result:
Let's break it down.

- At line 3, we use the ISBLANK and HASONEVALUE function to make sure the measure only returns data where it makes sense. Just like we did with the ranking measure.
- At line 5, we use a variable to hold the rank of the current row. Looking back at the table, this will return rank 4 for employee9. It's stored in a variable so we can use it later while we're in a different filter context. At this point in the formula, the employee table is filtered by the employee selected in the current row.
- In line 7-10, the magic happens. At line 8, we remove the context filter introduced by the table rows, which means we can look at all employees displayed in the table. With the FILTER function, we're only keeping the employees for which it's rank is equal or lower to the rank stored in the variable currank (see previous step). For example, suppose the current row is employee9 with rank 4. The FILTER function will return employee6, employee4, employee1 and employee9 because their ranks or equal to or lower than 4. Then, using the SUMX function, we will sum the number of sick days for those employees. 15 + 11 + 10 + 6 equals 42!
Now we have the running total, we just need to divide it with the grand total of sickness days, which is 49. The measure becomes:
Sickness Pareto =
VAR SickGT =
    IF(ISBLANK([# Sick Days])
        ,BLANK()
        ,CALCULATE([# Sick Days],ALLSELECTED(DimEmployee))
    )
RETURN DIVIDE([Sickness Running Total],SickGT)
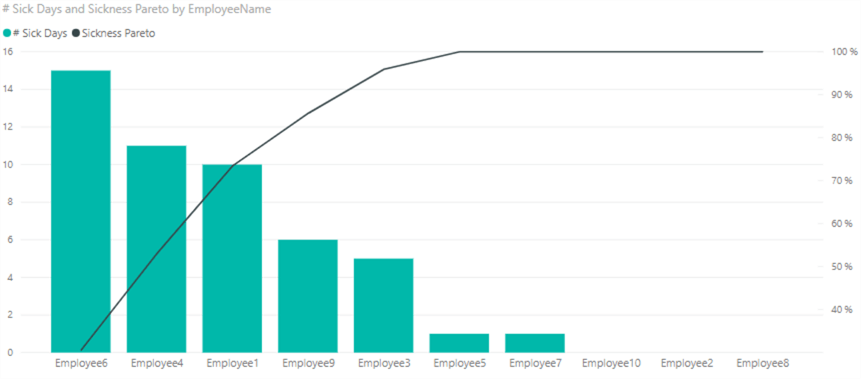
First we calculate the grand total by again removing the context filter using ALLSELECTED and the CALCULATE function. This result is stored in a variable for legibility. The division of the running total by this grand total is returned:
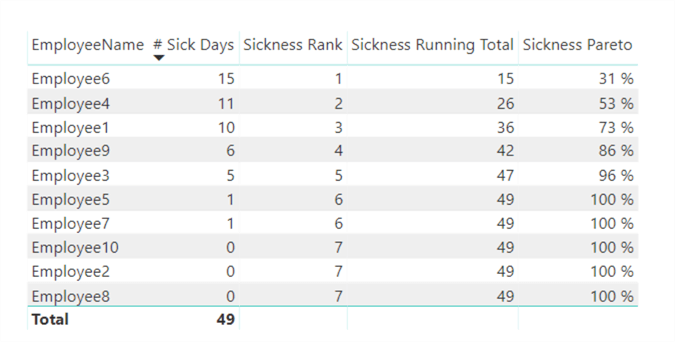
As you can see, only 3 employees contribute to 73% of the number of sick days. With 4 employees we're over 80%. When we turn this into a chart, we get our Pareto analysis:
Next Steps
- If you want to follow along, you can download the Power BI Desktop model here. Run the T-SQL scripts to create the sample data in your SQL Server instance (preferably not in production) and change the connection in the .pbix file to point to your database.
- The solution in this tip is basic and might not hold under every circumstance. For example, what if the employee dimension is a slowly changing dimension type 2, holding history for the employees. Now it's possible one employee has multiple valid rows in one single month. Think about how you would need to change the DAX formulas to fit your situation.
- For more Power BI tips, check this overview.
Learn more about Power BI in this 3 hour training course.


About the author
 Koen Verbeeck is a seasoned business intelligence consultant at AE. He has over a decade of experience with the Microsoft Data Platform in numerous industries. He holds several certifications and is a prolific writer contributing content about SSIS, ADF, SSAS, SSRS, MDS, Power BI, Snowflake and Azure services. He has spoken at PASS, SQLBits, dataMinds Connect and delivers webinars on MSSQLTips.com. Koen has been awarded the Microsoft MVP data platform award for many years.
This author pledges the content of this article is based on professional experience and not AI generated.
View all my tips
