By: Aakash Patel | Comments | Related: > Performance Tuning
Problem
Occasionally a SQL Server encounters a performance problem which can’t be addressed by just optimizing problematic code or tweaking some server level settings. In those situations, we must take a holistic approach for identifying the resource bottleneck. In this tip, I will show how to set up a Perfmon collection to identify memory pressure on the plan cache and how we ended up using Trace Flag 8032 for the solution.
Solution
There are various SQL Server Performance monitoring tools available in the market which can guide us if a server is having memory pressure based on performance counters such as SQL compilation/sec, Cache Hit Ratio, Page life expectancy, etc. But when you are chasing the root cause, you will have to study the server statistics over a longer period with more granular data and most of the monitoring tools will roll up historical data to save space and for speed efficiency. In such situations, we must go back to native performance counters and start collecting/analyzing the data ourselves.
SQL Server reserves a portion of assigned memory to store compiled plans which is called the Plan Cache. The majority of plans are either stored procedure or ad-hoc SQL. Here is an in-depth material from Microsoft on the plan cache.
Now, we will go through the steps to setup Perfmon to gauge the memory foot print of the SQL Server plan cache. We will create a process to load perfmon data directly into SQL Server.
Please setup and store perfmon collection data on a utility box. You should not use a production server for monitoring and data collection. It is always best to offload this to another server to minimize resource consumption.
Step 1: Create a Data Source
- Log on to your utility server.
- Create a new ODBC Data Source (preferably a 64-bit) following the steps below.
- In the ODBC Data Source Administrator, go to System DSN tab, click Add, select SQL Server and then click Finish.
- Fill in details for Name, Description and Server and click Next (Note: the server should the utility box where we will write the Perfmon data and run analysis queries).
- Select the authentication configuration you want to use and click Next.
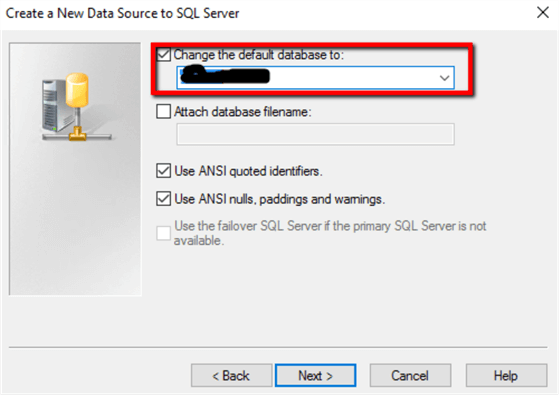
- Change the default database to the user database where the monitoring data will be stored and select any other options needed on this tab and click Next.
- On the last screen, make any changes necessary and click Finish.
Step 2: Create Perfmon Data Collector Set
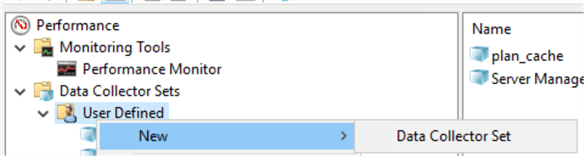
- Open Performance Monitor and expand the Data Collector Sets and expand User Defined.
- Right click on User Defined and select New > Data Collector Set. Name the data collector set and select "Create Manually (Advanced)" and click Next.
- Select "Performance counter" under Create data logs and click Next.
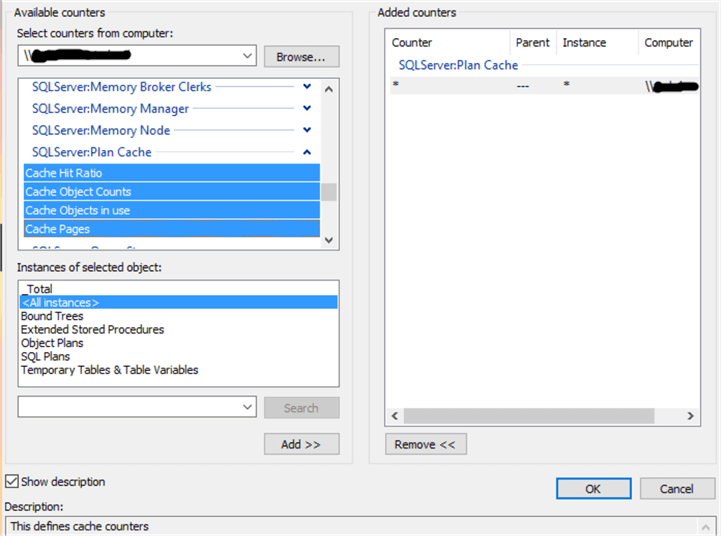
- Select the computer you want to monitor in the Select counters from computer box.
- Select the following counters for the server you want to monitor and
then click OK:
- Processor > % Processor Time
- SQLServer:Buffer Manager > Page life expectancy
- SQLServer:Plan Cache > Cache Hit Ratio, Cache Object Counts, Cache Objects in use, Cache Pages for <All instance> ( Bound Trees, Extended stored procedure, Object Plans, SQL Plans, Temporary tables & table var.)
- SQLServer:SQL Statistics > Batch Requests/sec, SQL Compilations/sec, SQL Re-Compilations/sec
- VM Memory > Memory Used in MB
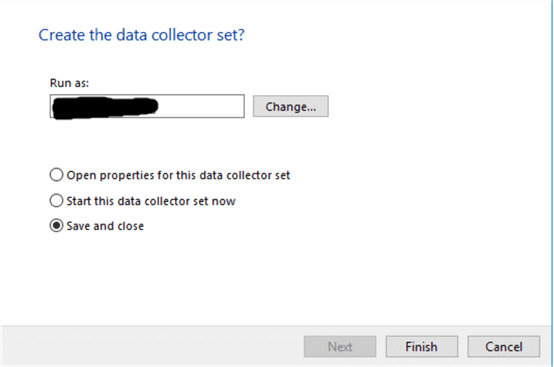
- Reduce the sampling interval as needed. In the Run as, use a service account to run the data collector set which has access to both the monitored and monitoring servers and then click Finish.
Read about the above perfmon counters if you are not familiar what each one indicates. It has been explained by multiple MVPs and easily found on the internet. Some of the perfmon counters are listed here on MSSQLTips.
Step 3: Configure Data Collector to Write to SQL Server
- Go to the Data Collector Sets, select the new data collector that you setup and select Properties.
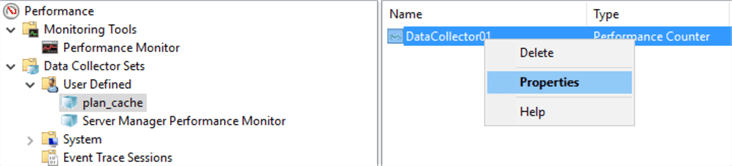
- Change log format to "SQL" and select the Data Source we setup in step 1.
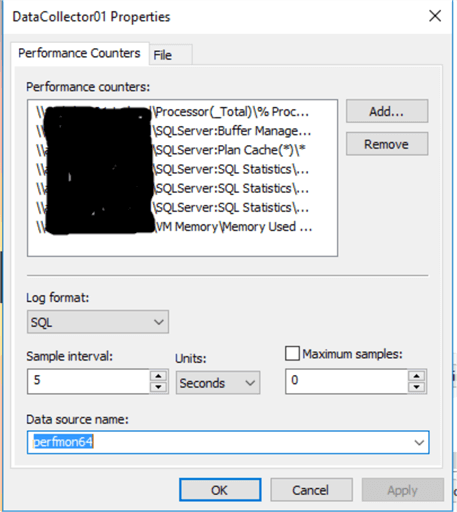
Step 4: Start Data Collection
- Right click on the data collector we setup and click Start to begin collection
- The below tables should appear in your SQL Server monitoring database:
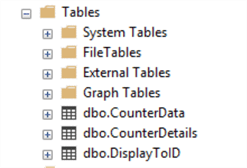
Table dbo.CounterDetails contains information about perfmon counters we are collecting data for and dbo.CounterData holds the actual data, make sure both tables are populating.
Data Analysis and Conclusion
Now that we have data collection setup, we can start analyzing the data. For some reason, Perfmon inserts the datetime value as char(24). You can use the below query to get started and tweak as necessary. Make sure counterID in your dbo.CounterDetails matches against the below query and change if necessary.
declare @start_timechar(24)='2019-12-27 11:30:00.0'
declare @end_timechar(24)= '2019-12-27 13:50:00.0'
-----------------plan cache metrics -----------------------------
SELECT
   avg([1])as'cpu',
   min(cast([2]/3600asint))as'PLE_hour',
   max(cast([3]asint))'batches/sec',
   max(CAST([4]asint))'compilations/sec',
   max(CAST([5]asint))'re-compilation/sec',
   avg(cast([6]/1024asint))as'vm_memory',
   min(cast([10]asint))'Adhoc_cache_hit_ratio',
   min(cast([11]asint))'Proc_cache_hit_ratio',
   min(cast([16]/128asint))as'AdhocCache_MB',
   min(cast([17]/128asint))'ProcCache_MB',
   min([22]) as'No_of_adhocplans',
   min([23])as'No_of_ProcPlans'
 FROM
 (
 SELECT [CounterID]
      ,[CounterDateTime]
     ,[CounterValue]
 FROM [yourdatabase].[dbo].[counterData] (nolock)
 where 1=1
 and [CounterDateTime] > @start_time
 and [CounterDateTime] < @end_time
 )as SrcTblPIVOT(AVG([CounterValue])FOR [CounterID]IN([1],[2],[3],[4],[5],[6],[10],[11],[16],[17],[22],[23]))AS pivottable;
After analyzing the data over a long period, we were able to conclude that there was continuous memory pressure on the plan cache. Ideally, we want to see the cache hit ratio for stored procs above 95% in a stable environment. To alleviate the memory pressure on the plan cache we decided to increase the total memory on the server to increase the plan cache size. When we increased the server memory (230%), the plan cache grew, but it was nominal growth on plan cache side (20%) this was due to an internal algorithm in SQL Server that determines the size.
As a next step we decided to reduce the memory back to where it was and turn on Trace Flag 8032. This trace flag reverts the plan cache limit algorithm back to the SQL Server 2005 settings and allows a bigger portion of memory to the plan cache. The exact plan cache limits with/without the Trace Flag are mentioned in this blog post by Erin Stellato, TYVM Erin!!! Here is the verbatim from Microsoft:
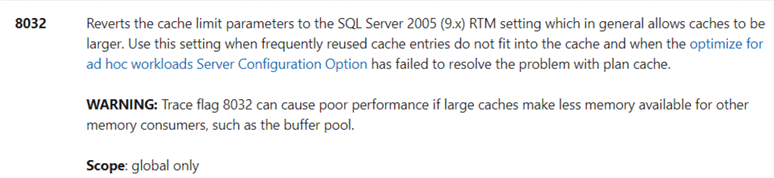
You must add this Trace Flag as a startup parameter and it requires a restart of the database engine service to be enabled or disabled (DBCC TRACEON doesn’t work). As soon as we enabled the Trace Flag, we noticed a significant drop in CPU along with a huge growth in the plan cache size (500%). In less than a day the plan cache stabilized at ~27gb with 160k entries for SQL Plans and 30k entries for stored procedure plans. CPU usage dropped by 40% due to significant reduction in compilations and re-compilations.
I wish, Microsoft allowed us to tweak the plan cache size for both stored procedures and ad-hoc sql as part of the sp_configure settings. I have entered this proposal on feedback.azure.com, but it’s been waiting for moderator approval for months and not public yet.
Trace Flag 8032 worked for us because of the unique use case we have, we host lots of tiny databases on a server. I strongly recommend doing thorough research before using this trace flag on a production environment.
Also, turning off this trace flag is not as trivial as just executing DBCC TRACEOFF, you need a service restart to disable it, so be cautious.
Next Steps
- Also explore sys.dm_os_memory_clerks to check out the memory footprint.


About the author
 Aakash Patel is a Senior SQL Server DBA for a software firm in Connecticut with 10+ years of experience.
This author pledges the content of this article is based on professional experience and not AI generated.
View all my tips
