By: Scott Murray | Comments | Related: > Power BI Formatting
Problem
What is Power BI Personalization and how can it be used to benefit end users?
Solution
As a Power BI report designer (and any report designer in general), one of those frustrating moments is when you complete a "fine" looking report, and then the end report consumer starts saying, "can you change this visual to that visual?" or "can you add a legend to this visual?" or "can you change XYZ?" Furthermore, often one report consumer, for example the CFO, likes to see his Power BI Dashboard with all Bar Charts; however, another user, for instance the COO, prefers to see Column charts used. Fortunately, Power BI now offers a feature for end users to customize many properties of a visual including changing the visual / chart type, adding or changing the fields used, or adjusting to tool tips that are displayed.
Let us see how we can use the personalization feature to enable and ultimately allow a report consumer to personalize their own Power BI Report. However, before we get into the examples, you need to be sure to download the latest version of Power BI desktop from here. Additionally, we will be using the WideWorldImportersDW database as a basis for our data sources; this database can be downloaded, if needed. If you need a refresher on bringing data into Power BI please see this tip.
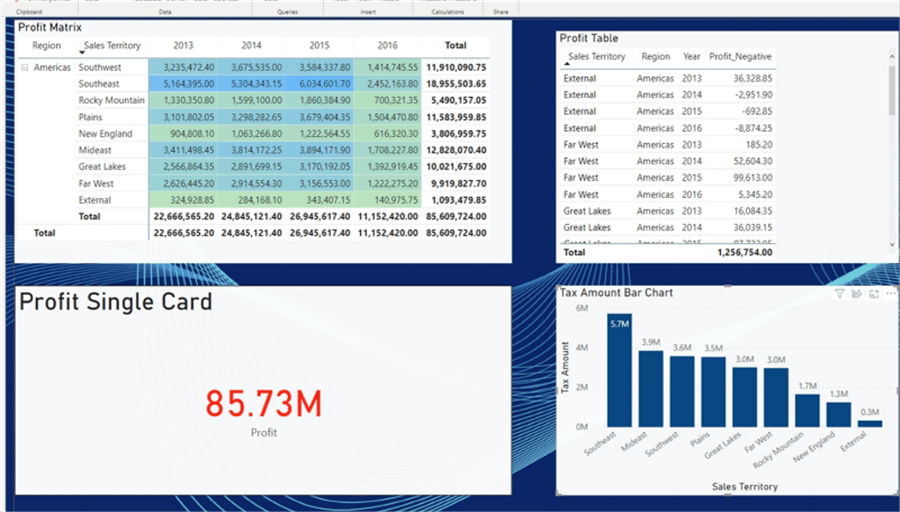
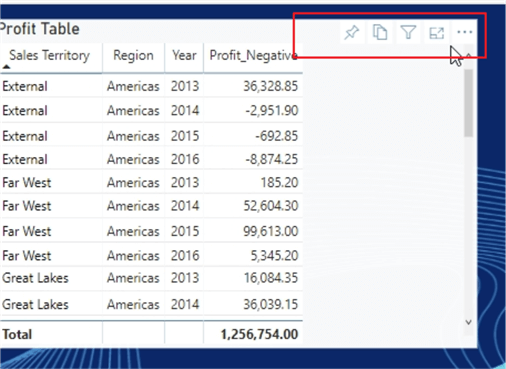
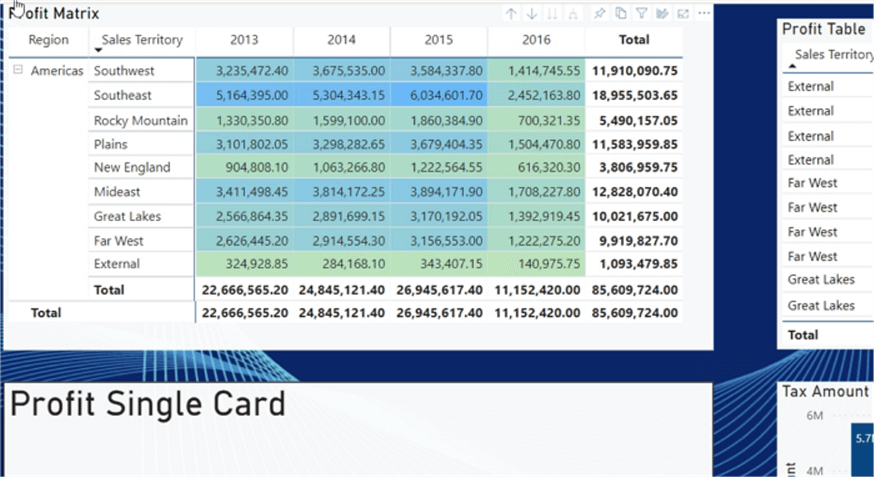
As a starting point, a simple set of data queries and a simple report is created. Specifically, the Dimension City, Dimension Customer, Dimension Date, and Fact Sales tables are brought in from the Wide World Importers database. Then as shown below, we add a matrix, a table, a card and a bar chart to the design grid.
To get started with personalization, two settings must be adjusted to start the process and set the report visuals up for personalization.
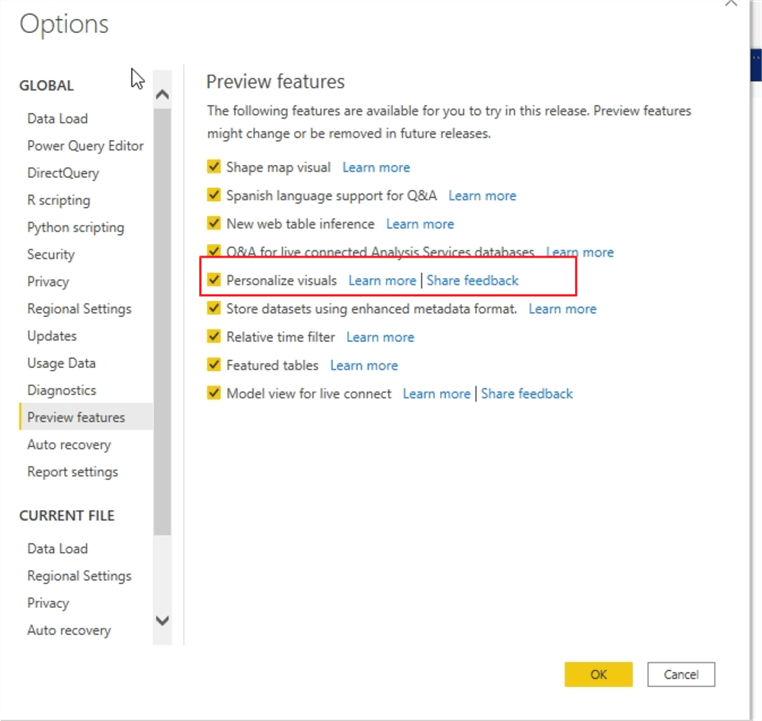
The first option is to turn on the Personalize Visual option by clicking the check box under Preview Features option (note that this feature may move to production and thus this property would no longer need to be checked). This option is turned on in the screen print below.
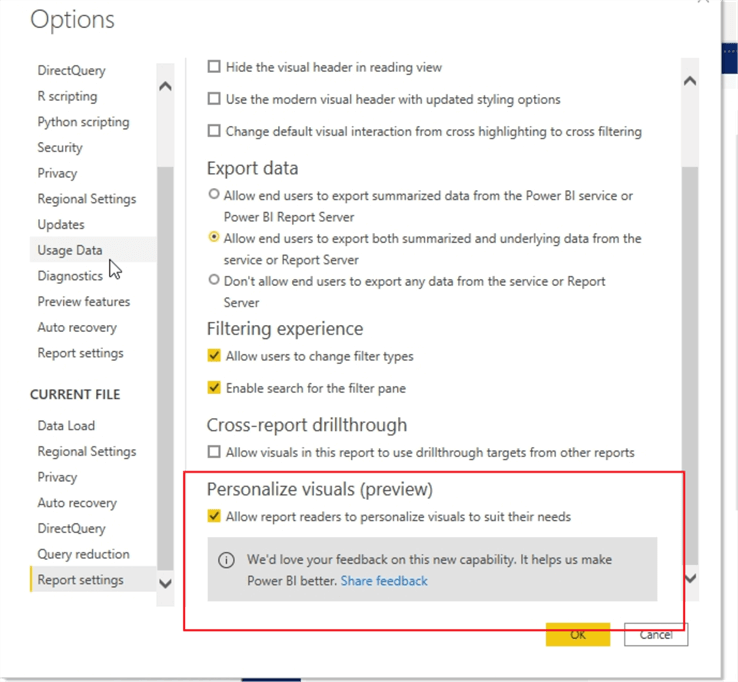
Similarly, under Options in the CURRENT FILE section, the Personalize Visuals property must also be checked to turn on this feature for the current PBIX file.
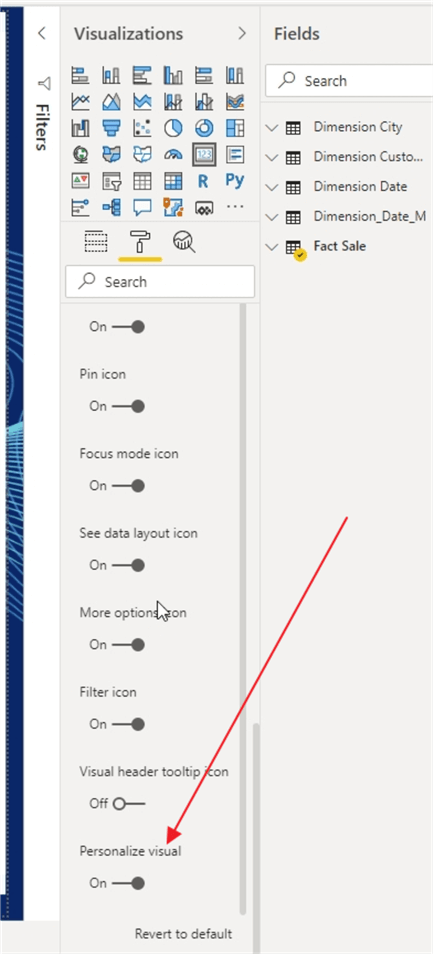
In addition to setting this option at the Report Level, each visual can be toggled on and off by adjusting, as shown below, noted setting under the Visual Header formatting option (paint brush button under visualizations).
We are ready to move the Power BI Service where we show personalization in action. Thus, we must publish our Power BI Desktop file to the Power BI webservice.
As shown below, on our newly published dashboard, one of the options in the upper right corner of the visual includes a new personalization button.
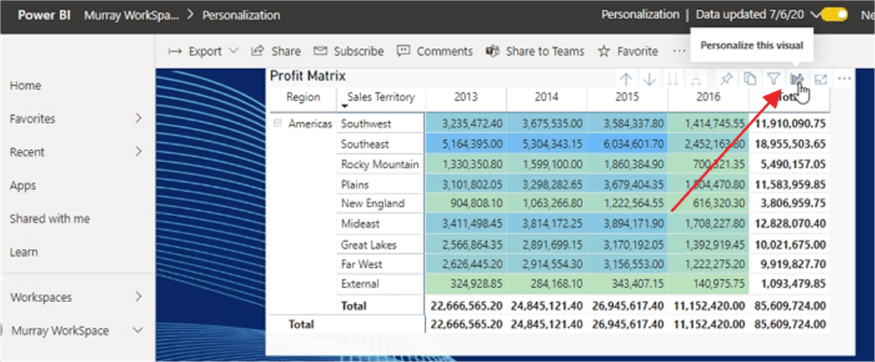
This button will not be available if personalization was turned off for the selected visual, as outlined in the previous section and screen print.
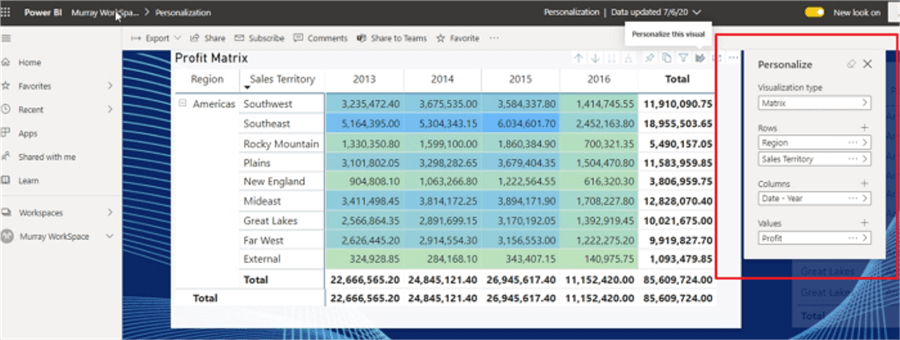
Now the power of personalization can be fully shown. Clicking on the personalization button in the visual header provides a pop out box that allows for adjusting various personalization options for the visual.
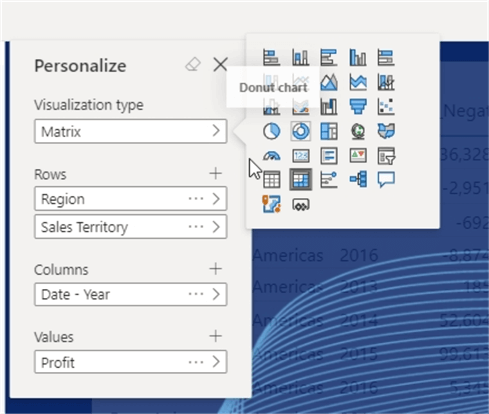
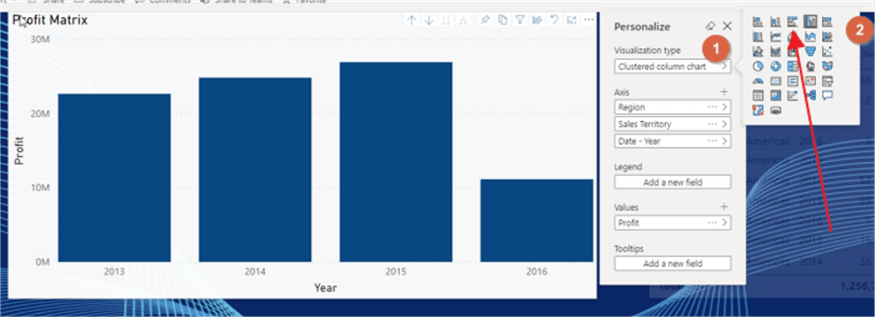
The first adjustment that can be made is to change out the visual type. As displayed below, the visual type can be changed to any standard visual (custom visuals do not show up in the selection).
With the click of a button, the matrix is changed to a clustered column chart.
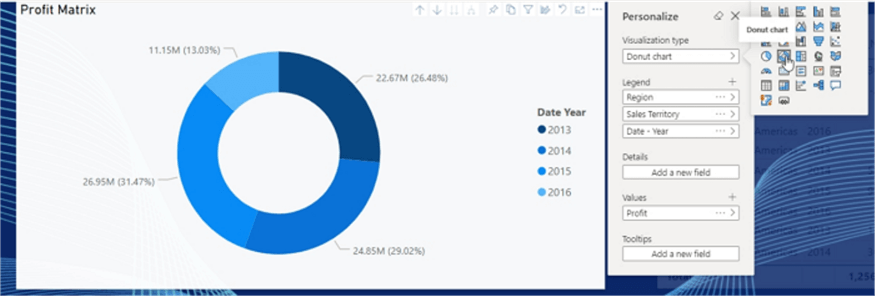
Likewise, I can easily test out several visuals by selecting each and reviewing the result.
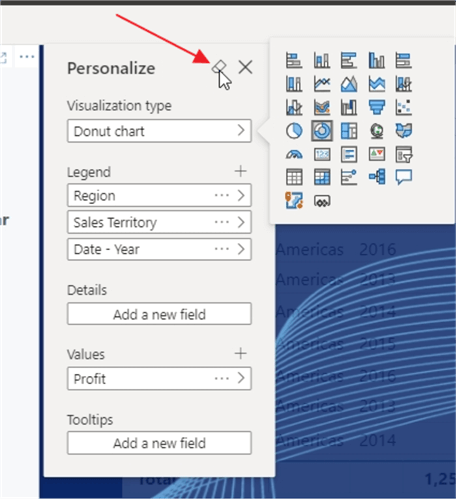
If I would like to go back to the original visual, the erase button clears any personalization.
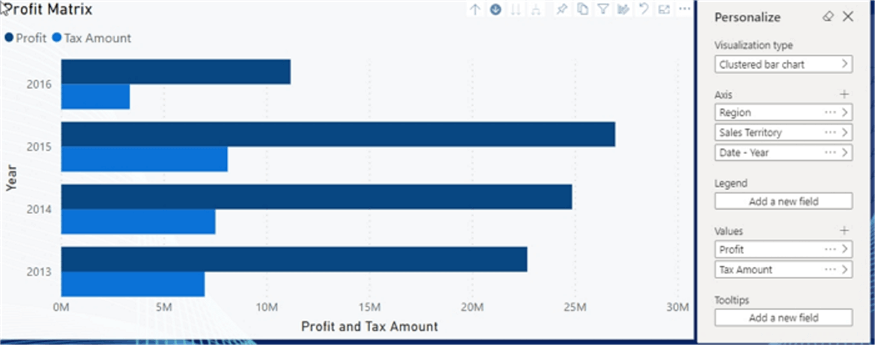
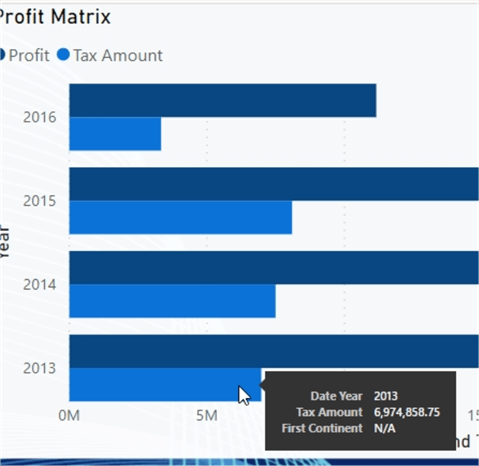
Not only can we change the visual type, but we can also change, add, or remove the fields included in the data set for the visual. For instance, using the clustered bar chart personalization, we can add Tax Amount as a new value.
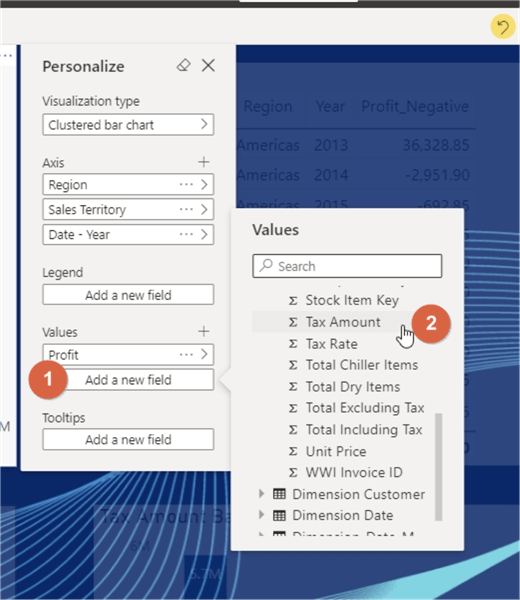
Now our visual shows both the tax amount along with the profit figure.
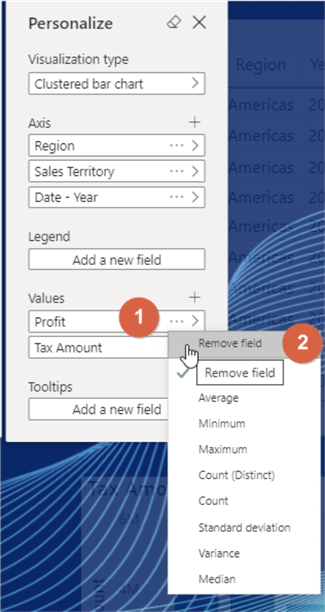
We could also remove the profit measure if desired by clicking on the 3-dot ellipse next to the measure name and selecting Remove field.
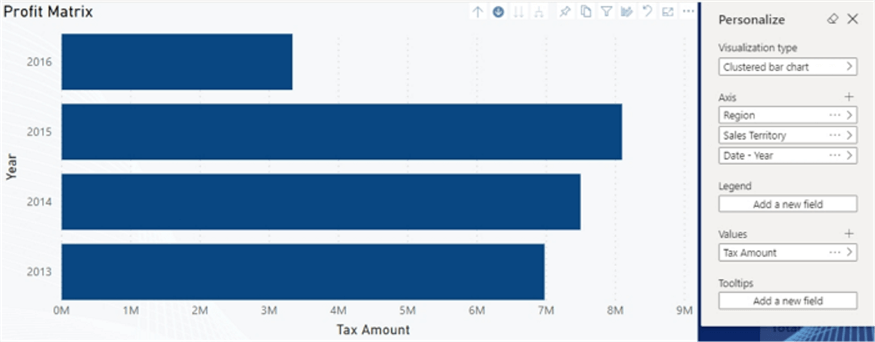
Now the visual just shows the tax amount.
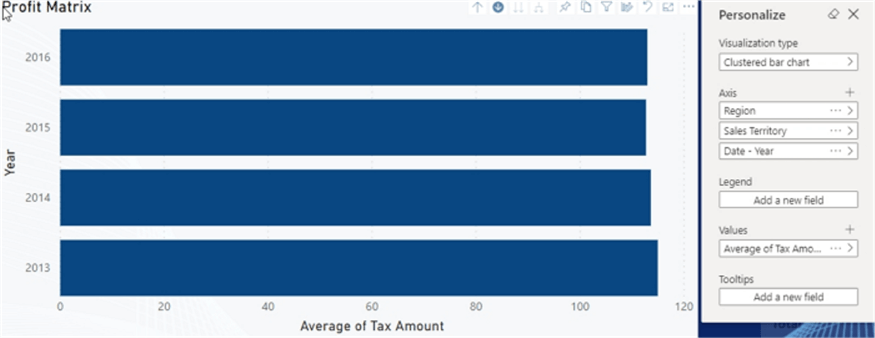
We could also change the measure aggregation to average, count, minimum, maximum, or several other various aggregations.
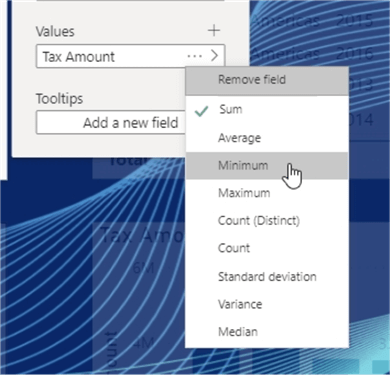
Now our visual is showing the average of the tax amount.
As we make all these changes, you hopefully are also seeing the advantages and benefits of being sure your field names are appropriate and meaningful to the end dashboard consumers.
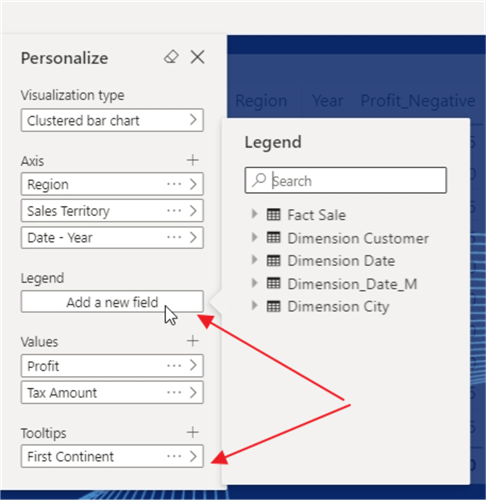
In a similar fashion to adding new fields and axis values noted above, we can also add fields to the legends and tool tips area.
One thing to note, if you exit the report or even refresh the screen, any personalization to a visual will not be saved. Likewise, if you click on the Reset to default, the visual will go back to its original format.
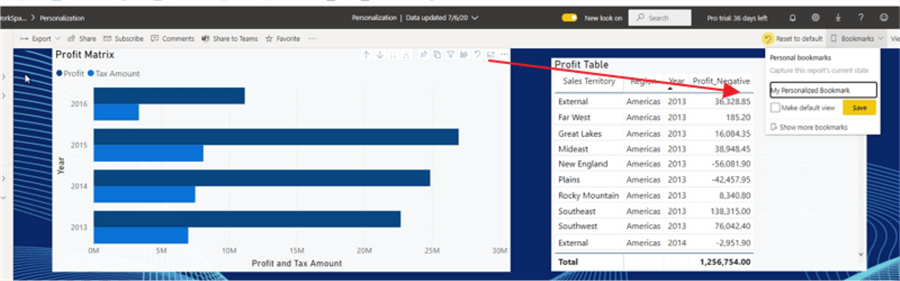
However, there are ways to save your changes for future review. One method is to use the Bookmarks functionality to save the current view of the report, as illustrated below.
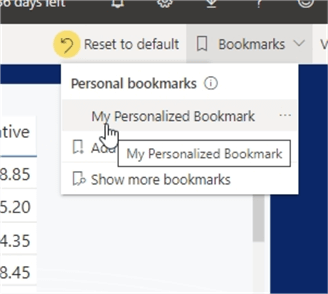
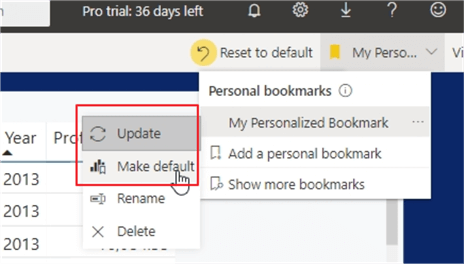
Now, after navigating to the report in the Power BI Service, the personalized version of the visual is saved (it would be saved for all visuals on the report if more than one was personalized – see this tip for details on bookmarks). Of course, as shown in the second screen print, a personal bookmark can be saved as the default view, so you would see the personalized visual(s) every time you navigate to this report.
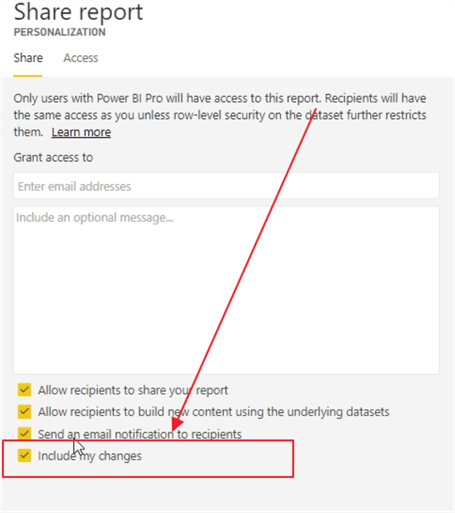
Finally, the report consumer can include his or her personalized visual(s) when sharing to other Power BI users who have access to the report.
The personalization feature in Power BI is really escalating the self-service visualization feature list. By providing end report consumers the ability to change a visual and / or to change the fields included on a visual, Microsoft is providing significant amount of flexibility and time savings techniques to dashboard developers and dashboard consumers.
Next Steps
Learn more about Power BI in this 3 hour training course.


About the author
 Scott Murray has a passion for crafting BI Solutions with SharePoint, SSAS, OLAP and SSRS.
This author pledges the content of this article is based on professional experience and not AI generated.
View all my tips
