By: Joe Gavin | Updated: 2021-07-30 | Comments | Related: > Monitoring
Problem
How can I use Windows Performance Monitor for troubleshooting Microsoft SQL Server performance issues?
Solution
We'll look at what Performance Monitor is and some examples of adding counters, saving reusable templates, and reporting on performance data.
What is Windows Performance Monitor?
Performance Monitor, commonly referred to as simply Perfmon, is a Windows program used by System Administrators to monitor a number of system areas and is a very useful tool for Database Administrators as well. It's been around since Microsoft Windows 3.51. Perfmon can show you information in real time or from log files for later viewing.
How can Performance Monitor Help Me?
Perfmon is able to monitor the standard performance Counters (CPU, processor time, memory, network, physical disk, disk read, etc.) that are installed with Windows operating system as well as specific counters installed with SQL Server.
Start Performance Monitor
Note: All examples were run on Windows Server 2019 Standard with SQL Server 2019 Standard.
There are a few ways to start Performance Monitor including:
- Start > Search enter Performance Monitor in the search box
- Start > Windows Administrative Tools > Performance Monitor
- Right click Start > Run > type perfmon in run box
- Windows key R > type Perfmon in run box (my favorite)
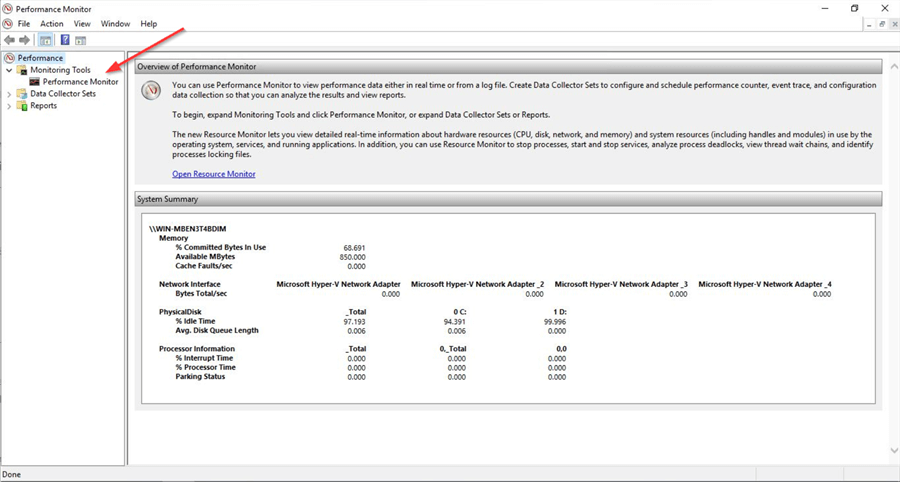
Whichever way you chose you'll be presented with Performance Monitor. Click Performance Monitor on the left side.
Adding Perfmon Counters
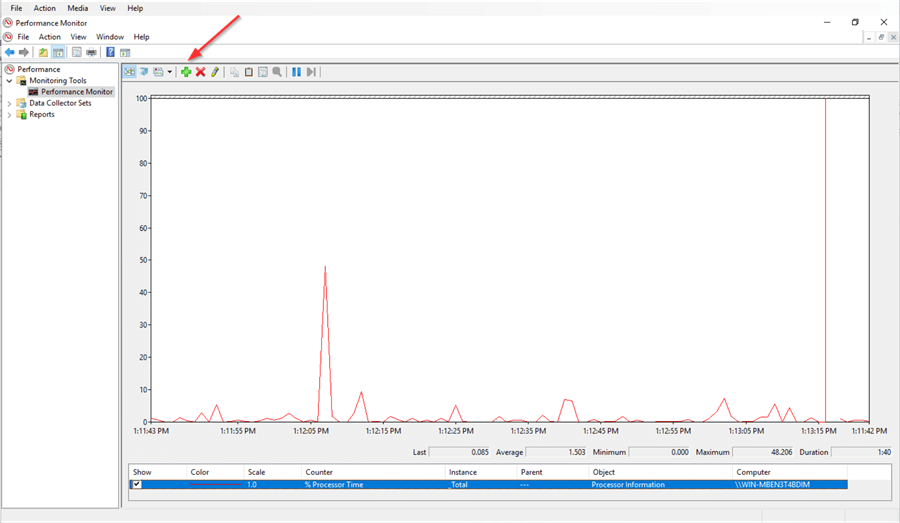
The % Processor Time Counter is running by default. Click on the green plus sign to start adding Counters.
You'll see a large number of Perfmon Objects, or categories, in the list. And under each Object there is an almost overwhelming number of Counters. That's OK, we're just going to focus on a few of them.
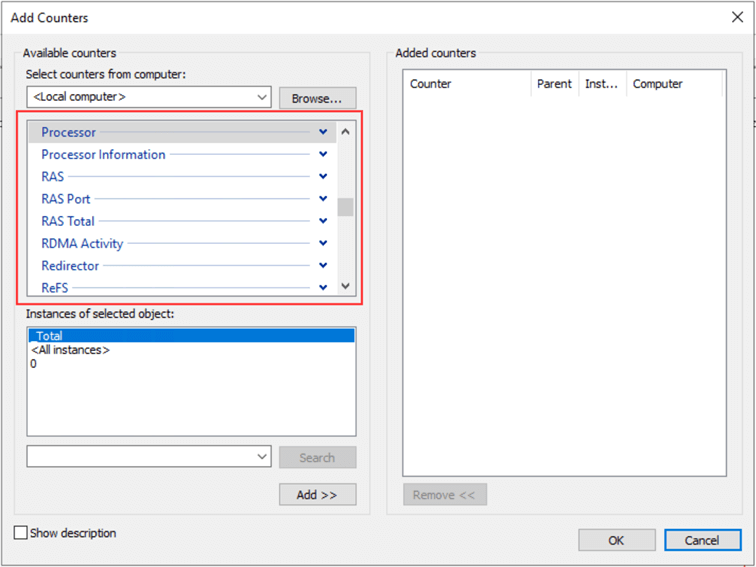
- Scroll up to the click the dropdown of the Object you want
- Select Counter
- Optionally select the 'Show description' box to get a description of the Counter
- Add
- OK
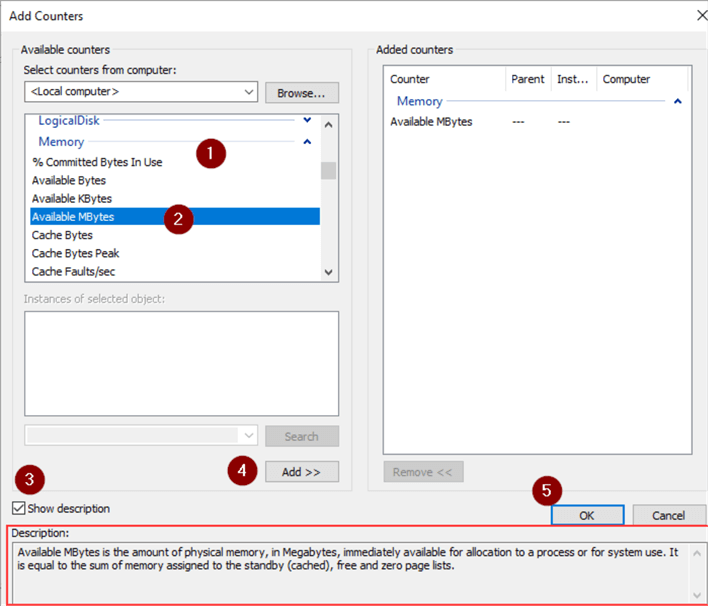
Clicking on the Counter will show us a graph of the added Counter and its metrics.
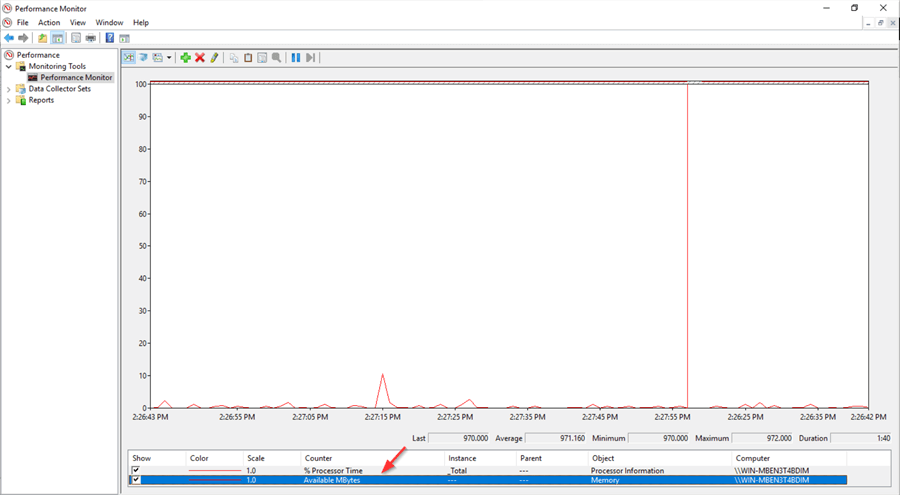
I've gone back and added some standard SQL Server monitoring counters the same way we added Memory \ AvailableMBytes and we now have the following Objects \ Counters running:
| Perfmon Object | Perfmon Counter |
|---|---|
| Memory | Available MBytes |
| Processor | % Processor Time |
| SQLServer:Access Methods | Forwarded Records/sec |
| SQLServer:Access Methods | Full scans/sec |
| SQLServer:Access Methods | Page Splits / Sec |
| SQLServer:Buffer Manager | Buffer Cache hit ratio |
| SQLServer:Buffer Manager | Checkpoint Pages / Sec |
| SQLServer:Buffer Manager | Page life expectancy |
| SQLServer:General Statistics | User Connections |
| SQLServer:Locks | Average Wait Time (ms) |
| SQLServer:Locks | Lock Waits / Sec |
| SQLServer:Memory Manager | Memory Grants Pending |
| SQLServer:Memory Manager | Target Server Memory (KB) |
| SQLServer:Memory Manager | Total Server Memory (KB) |
| SQLServer:SQL Statistics | Batch Requests/Sec |
| SQLServer:SQL Statistics | SQL Compilations/Sec |
| SQLServer:SQL Statistics | SQL Re-Compilations/Sec |
Create a Collector Set
Adding Counters is a bit tedious and it's very easy to accidentally close Perfmon and lose what you've added. So, it's a good idea at this point to save the Counters you're running to a Collector Set. This will let you pull them back up again easily after you're closed Perfmon.
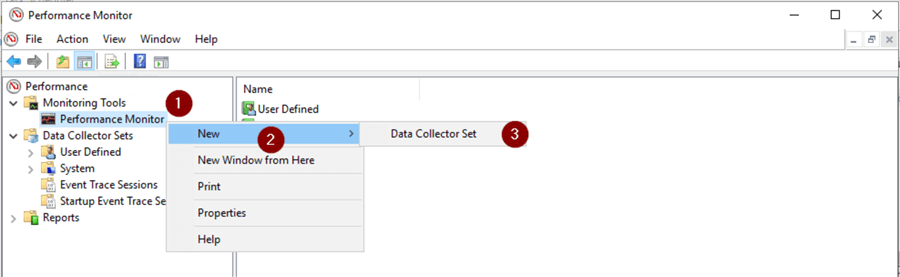
- Right click Performance Monitor
- New
- Data Collector Set
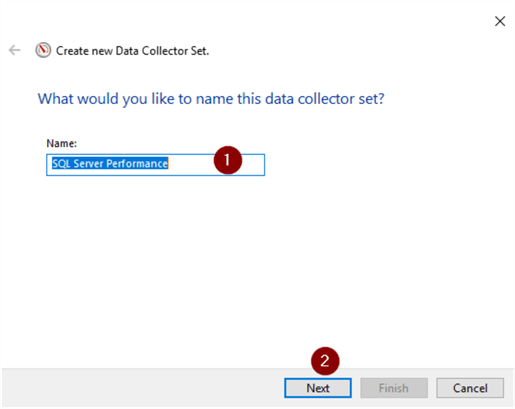
- Name Collector Set
- Next
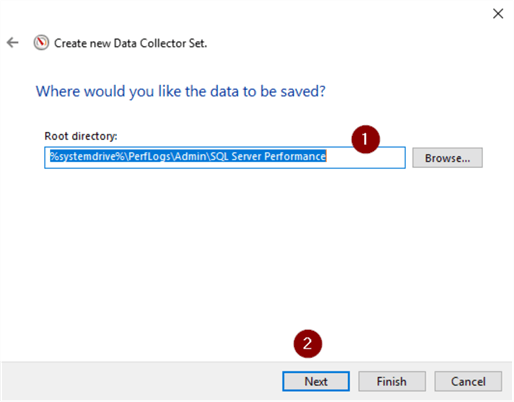
- Keep the default root directory or Browse… to another location
- Next
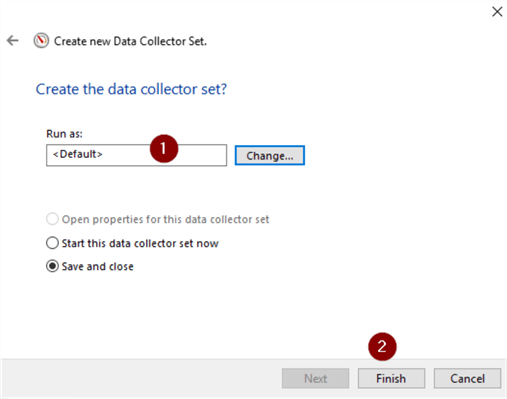
- Choose different account or leave as default
- Finish
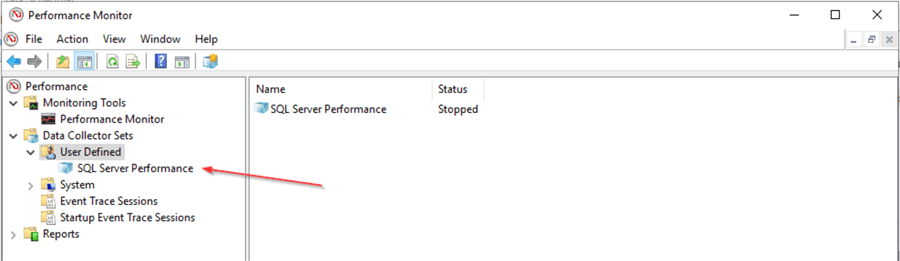
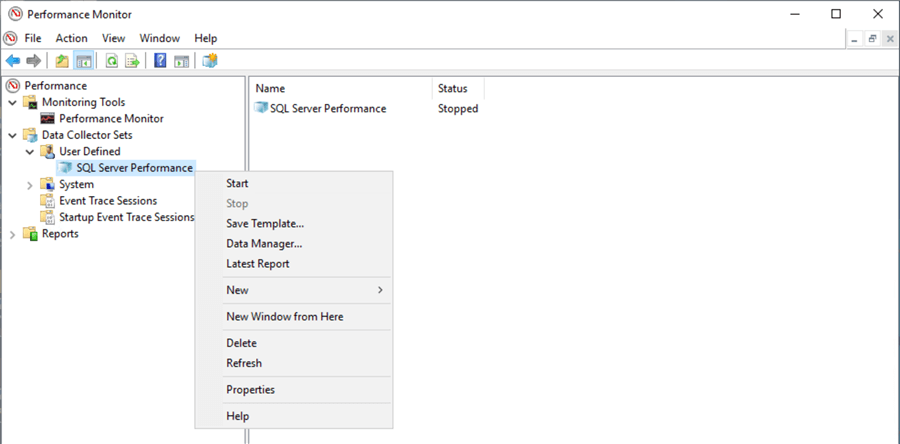
And here it is under Data Collector Sets > User Defined.
Saving Collector Set to a Template
Now that we have the Collector Set saved, let's export it to a template. The template is an editable .xml file that can be used on another Windows machine and is handy to have in your toolbox.
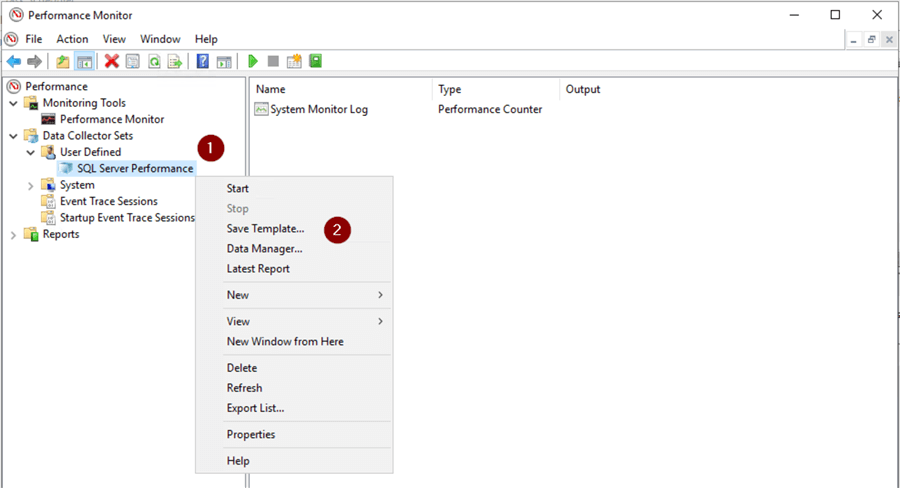
- Right click on the Collector Set
- Save Template…
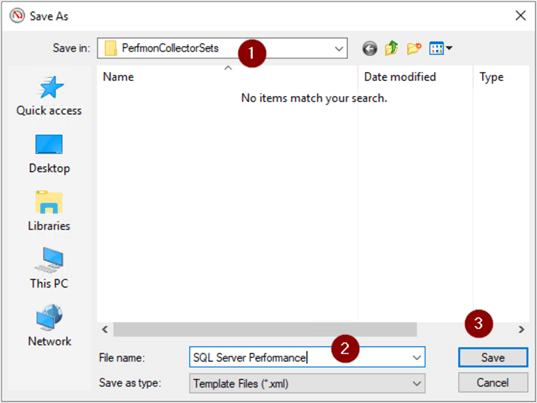
- Choose a location
- Give it a name
- Save
Opening Saved Template
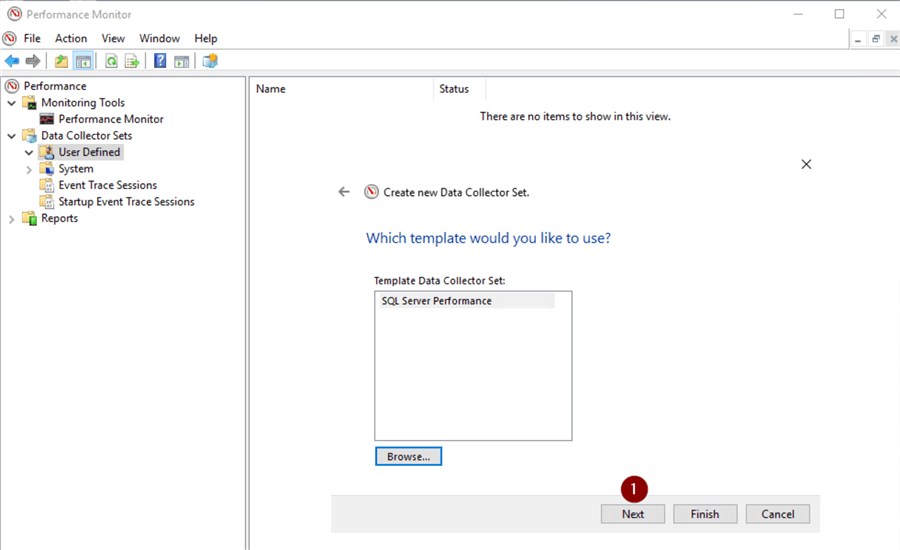
To demonstrate opening a saved template to a Collector Set on another machine I've deleted the existing Collector Set. Now we'll import the Template.
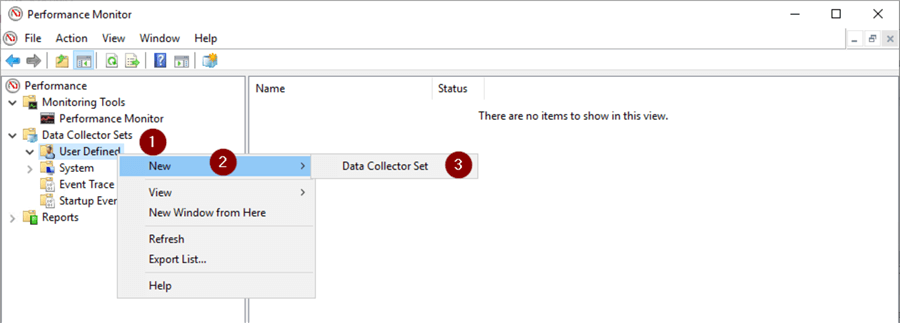
- Right click User Defined
- New
- Data Collector Set
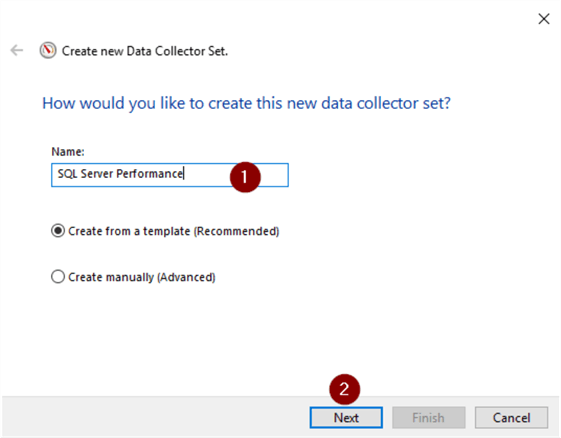
- Name it
- Next
- Browse
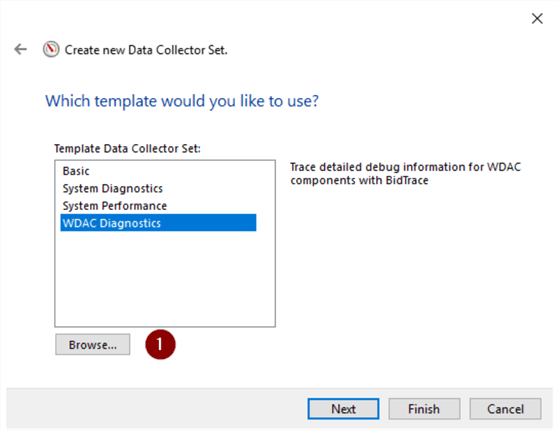
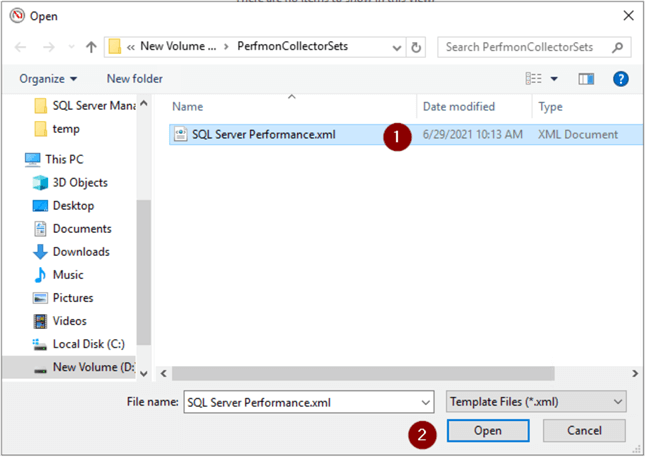
- Browse to saved template and select
- Open
- Next
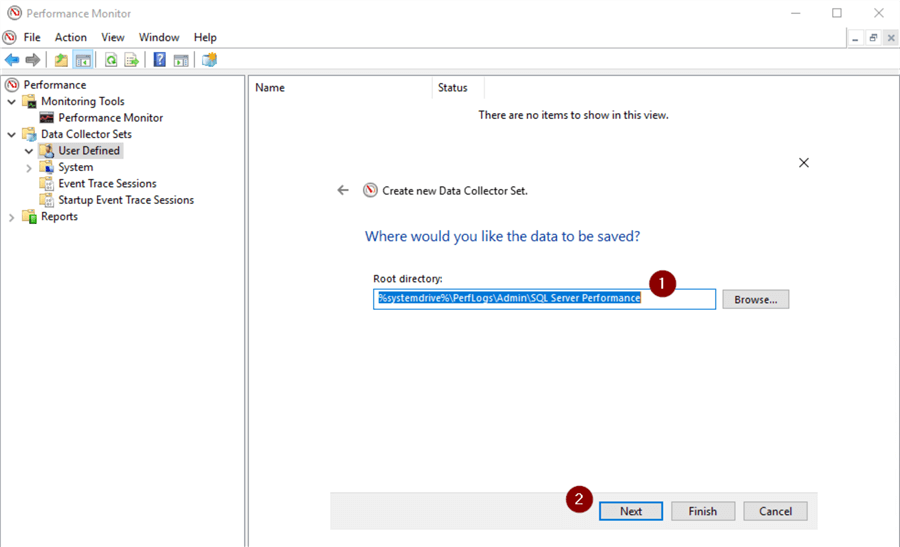
- Change data file location or leave at default
- Next
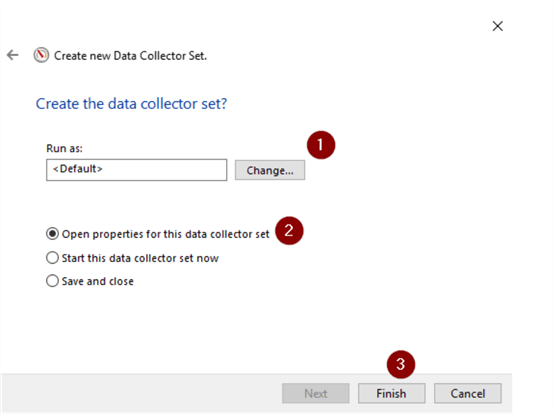
- Change 'Run as' (optional)
- Select 'Open properties for this data collector set'
- Finish
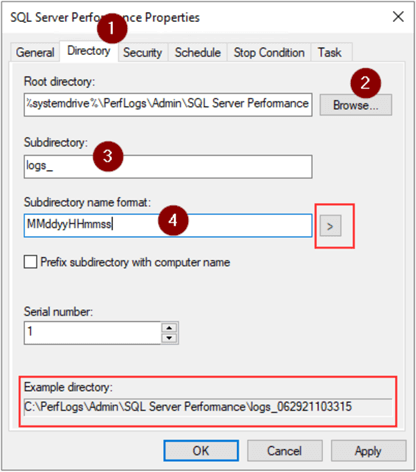
- Directory tab
- Change log directory (optional)
- Enter subdirectory name
- Enter date and timestamp format in 'subdirectory name format' box (I chose MMddyyHHmmss so I could start and stop it at will to be sure of a new report file name every time it ran. Otherwise, the Collector would fail to start with a 'When attempting to Start the Data Collector Set the following system error occurred: Cannot create a file when that file already existed.'. (Click right arrow for all supported formats.)
- Apply
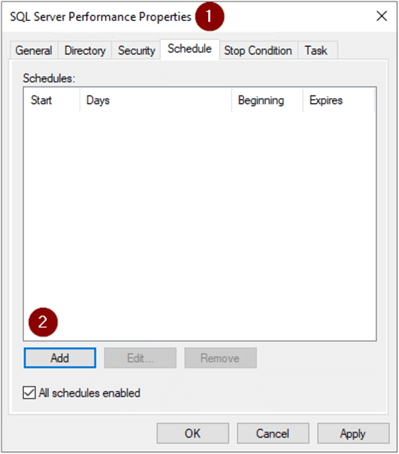
We can add a schedule to run the Collector Set.
- Click Schedule tab
- Add
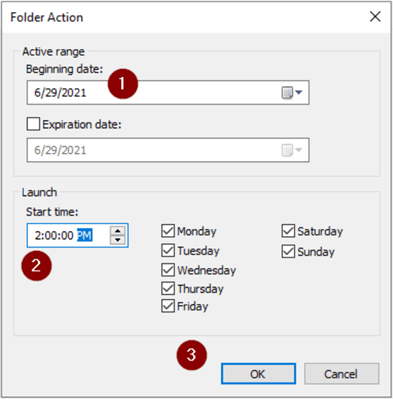
This schedule will run every day from 2:00PM to 3:00PM.
- Change ' Beginning date' (optional)
- Start time
- Select days of week to run
- OK
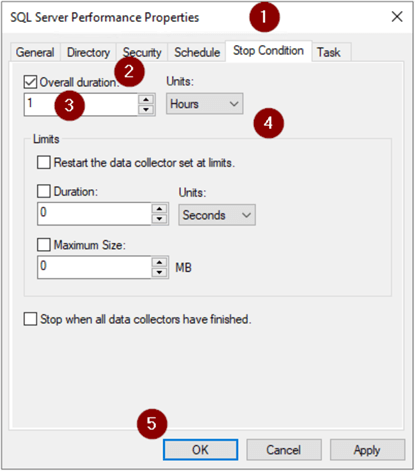
- Stop Condition tab
- 'Check 'Overall duration' box
- Enter duration
- Choose Unit of time
- OK
There is a known issue with Windows Server 2019 and some versions of Windows 10 where the Windows Task Scheduler Task created when you schedule a Collector Set does not run. Here is the workaround for that: User-defined data collector set doesn't run as scheduled.
Running Collector Set
Let's start gathering performance data.
- Right click on Collector Set
- Start
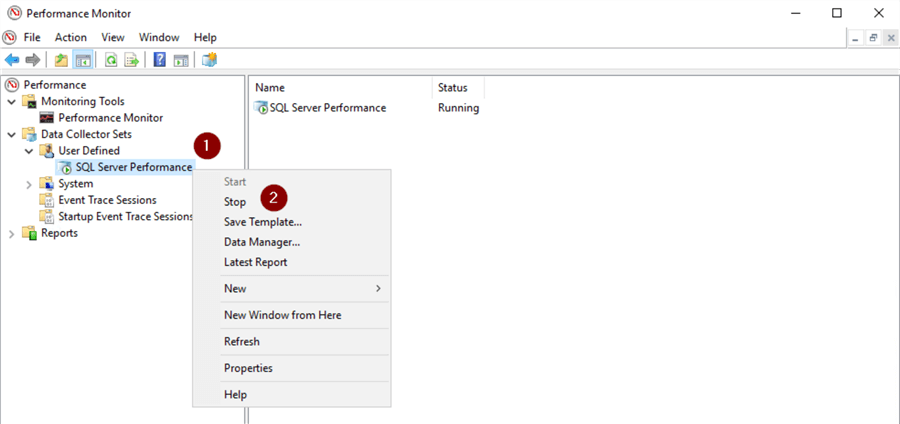
Stop Collector Set when you're ready to view data
- Right click on Collector Set
- Stop
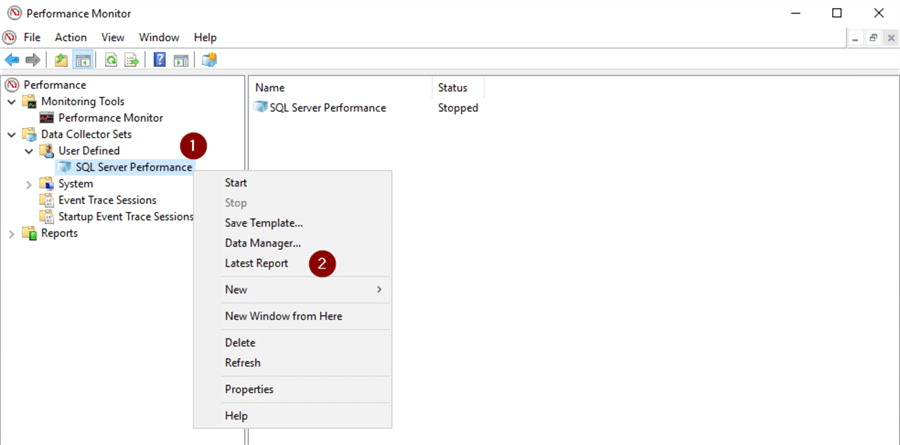
Display Counter data.
- Right click on Collector Set
- Latest Report
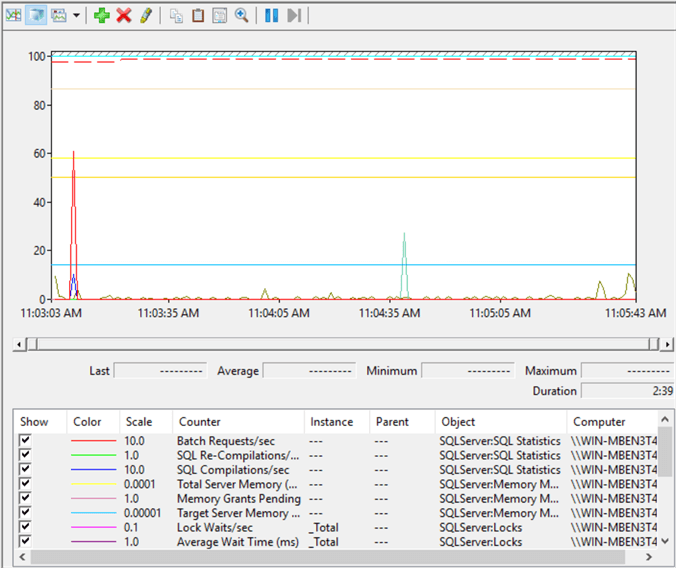
Here we can see our Counters on the screen and select individual Counters for more detail.
Next Steps
So far, we've seen how to:
- Open Perfmon
- Add Counters
- Save Counters to a Collector Set
- Export Collector Set to a template file
- Schedule a Collector Set
- Report on the Perfmon data collected
Stay tuned for a tip on what to look for in the performance monitoring report.
Here are some links with further information about monitoring tools:
- Performance Monitor
- Schedule Data Collection with Windows Performance Monitor
- Windows Performance Monitor Tutorial
- Windows Performance Monitor Counters for SQL Server


About the author
 Joe Gavin is from the Greater Boston area. He started working with SQL Server and Sybase in 1998 in the financial services industry and has been a SQL Server Database Administrator for a dairy cooperative since 2011. He graduated from Northeastern University in Boston with a Bachelor of Science in Engineering Technology (BSET) degree in Computer Technology. Joe has spoken at the Boston and Providence SQL Saturday events.
 This author pledges the content of this article is based on professional experience and not AI generated.
View all my tips
Article Last Updated: 2021-07-30
