By: Greg Robidoux
Overview
SQL Server provides a great tool that allows you to see what statements are running on your SQL Server as well as collecting metrics such as duration, number of reads, number of writes, the machine that ran the query, etc... this tool is known as Profiler.
Profiler is a GUI based tool that runs a SQL Server trace to capture the metrics listed above as well additional data. This data can then be used to determine where your SQL Server performance issues are related to your TSQL code. Running a trace without using Profiler is known as a Server Side Trace. You can create and start the trace using TSQL commands instead of having to use the GUI.
Explanation
Most people begin using Profiler to run a trace, because the GUI is pretty easy to get a trace setup and running. Once you understand the advantages of using a server side trace you will begin to use these more frequently unless you are troubleshooting an issue that is occurring at that exact time.
Profiler
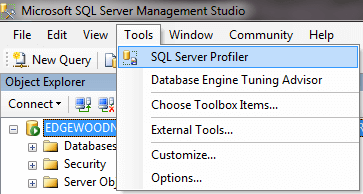
The Profiler tool can be launched in one of these ways:
- In SSMS, select Tools > SQL Server Profiler from the menu
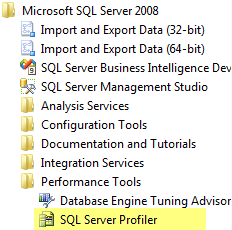
- You can also launch Profiler from the Windows menu
Once you have Profiler launched you need to:
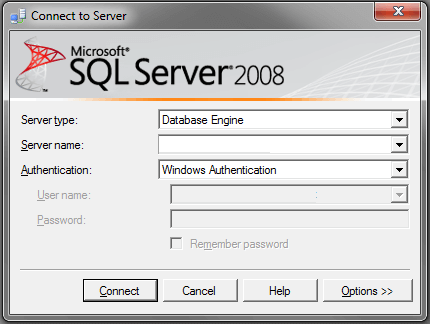
- Connect to the SQL Server instance you want to trace
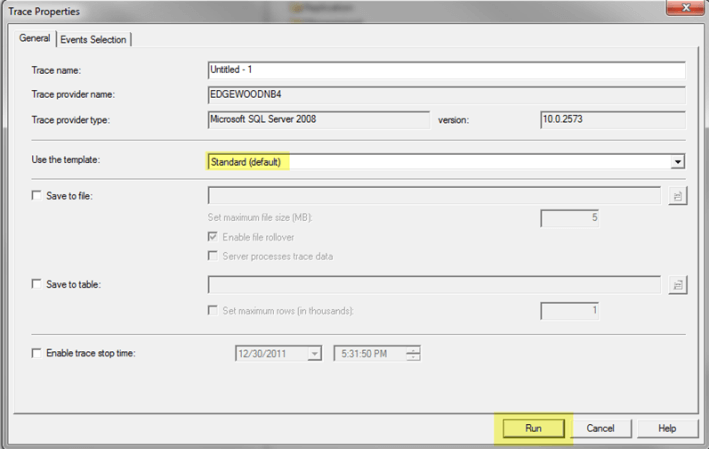
- A Trace Properties window will open and you can click Run to start the trace with the default settings
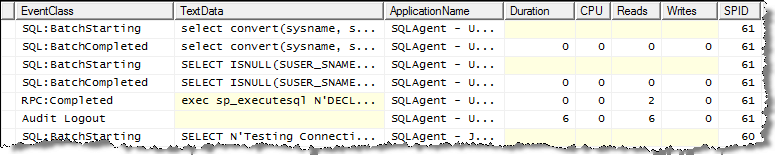
Here is an example of data that is collected:
Selecting Events, Columns and Filters
Ideally you want to select only the Events you want to capture along with setting Filters to minimize the amout of data that is returned. If you just use the standard settings you usually end up with too much information and it is hard to determine what is going on.
Under the Events Selection tab you can select events, columns and set filters as shown below.
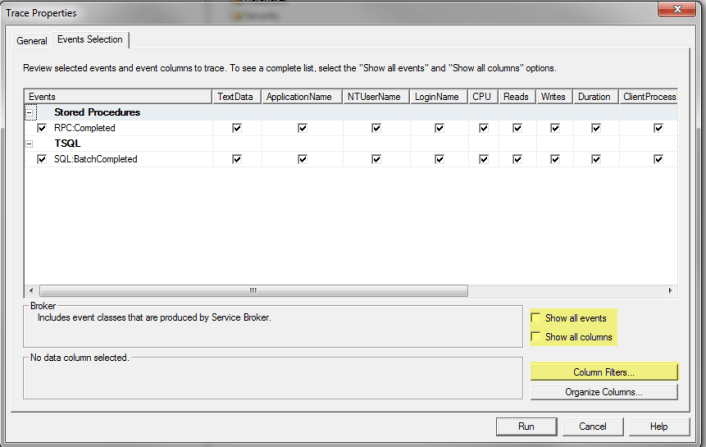
Events
A good starting place is to capture just these two events. These will show you all completed batches and metrics related to the batch. A batch is basically a set of work, like a stored procedure, that contains mulieple statements.
- Stored Procedures - RPC:Completed
- TSQL - SQL:BatchCompleted
Columns
As far as columns go just select all columns and once you see the data that is captured you can reduce the amount of columns you are capturing.
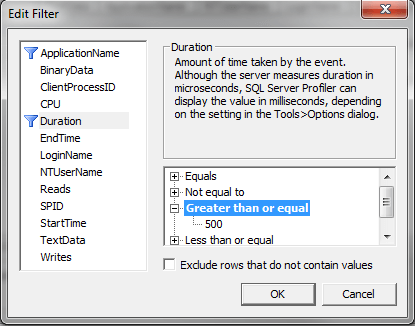
Filters
Filters allow you to further define what is captured. To set filters click on Column Filters. So if you only want to capture data for a specific process you can filter on SPID as an example. Another good starting point is to filter on Duration. I like to set the value to 500 to only show statements that take 500ms or longer. Again this is just a starting point.
Once you have the settings you want you can run the trace.
Reading the Output
After you have collected the output you can see which statements are returned based on the events and filters that you have set. If you start with the two events above you can begin to take a look at the statements that have the longest duration and these are the statements that you should begin trying to tune to improve performance.
Additional Information
Here are some additional articles related to Profiler and Server Side Traces.
- Creating a Trace Template in SQL Server Profiler
- Scheduling a SQL Server Profiler Trace
- SQL Server Profiler and Trace Tips
