By: Siddharth Mehta
Overview
Charts are the key visuals that are used to represent data in a graphical manner on a report or dashboard. Mobile Report Publisher offers different types of charts, which we will discuss here. Our intention is to understand the use of key configuration details of these charts. A detailed explanation of every property for every chart type is beyond the scope of this tutorial. We will cover the different charts in brief and touch upon important details.
Explanation
Every control has two sets of properties - Visual properties and Data properties. Selecting the control on the layout will show visual properties, and selecting the data tab for the same control will show the data properties associated with the control.
Pie and Funnel Charts
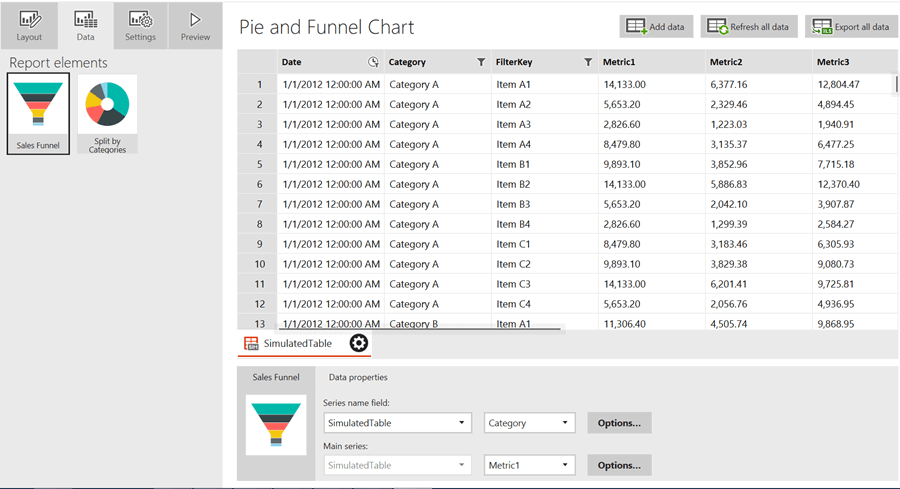
In Mobile Report Publisher, the simplest charts in terms of complexity are the funnel chart and pie chart. Funnel charts are very useful for representing data in a workflow. Pie charts are used to represent proportions of non-hierarchical data. The only two configurations that need to be completed are the category series and the data series as shown below.
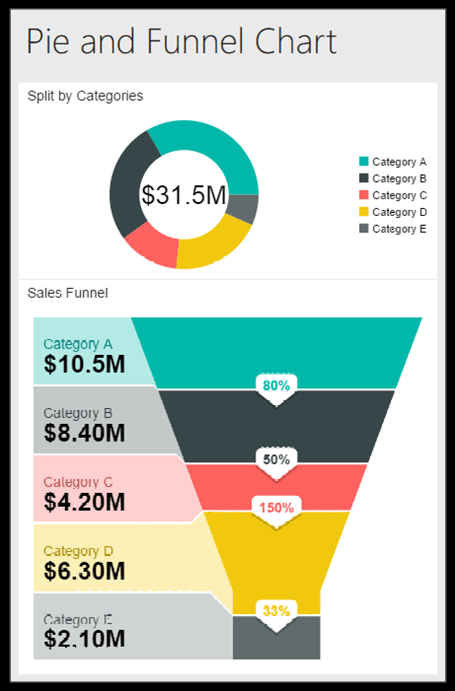
If we preview these charts on a mobile layout it would look as shown below. Clicking on individual slices will result in a pop-up that will display the selected value. Consider just dragging and dropping the chart controls with the default sample data and preview the behavior in mobile view.
Totals and Comparison Totals Charts
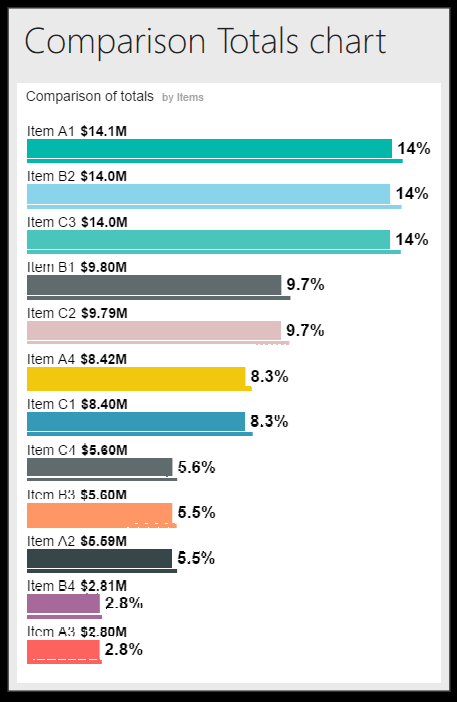
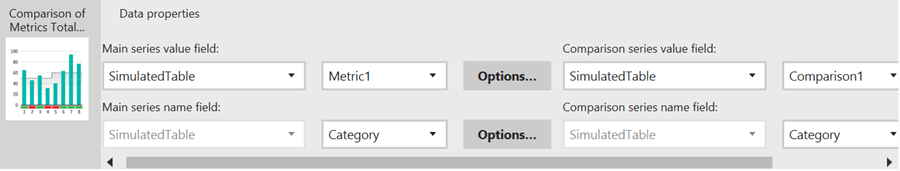
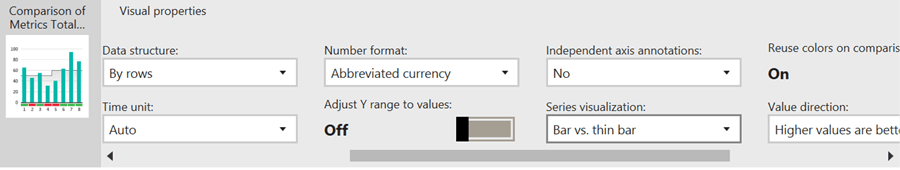
The next charts in line are Totals chart and Comparison Totals chart. These charts have the same configuration, but are used to show total values in terms of actual values or percentages. Comparison Totals chart uses a bar vs. a thin-bar visualization, where the thin bar represents the aggregated value of the comparison metric.
Category Charts
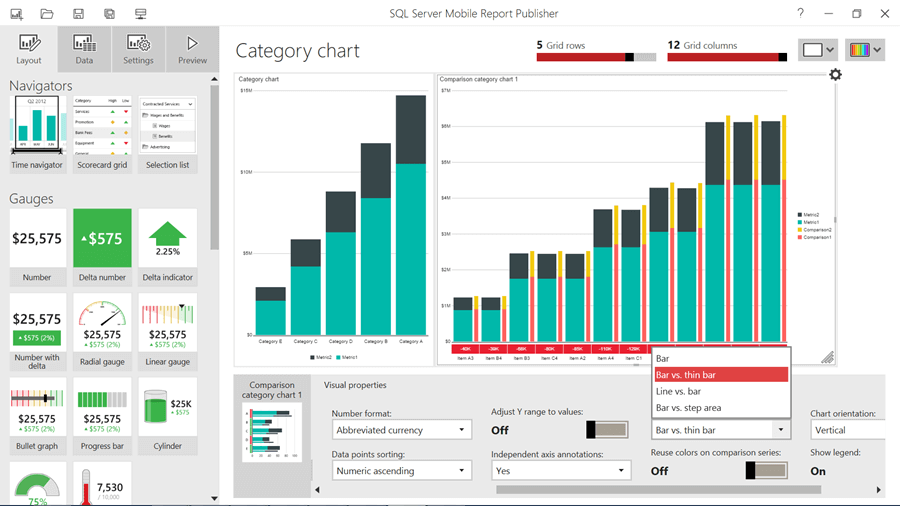
Category charts are similar to Totals charts, but provide additional options to display multiple series on the chart by classifying them in categories. For the comparison category visualization, you can also select the kind of chart for comparison as shown below.
Time and Comparison Time Charts
The most frequently used charts probably are the Time chart and Comparison Time chart. It has all the features as Category charts, with an option to display data over time. The configuration properties of the Time and Time Comparison charts are as shown below. Data can be read vertically or horizontally as required by configuring the data structure property. The Time Comparison chart allows us to configure actual and comparison series for value and labels as shown below.
Treemap Charts
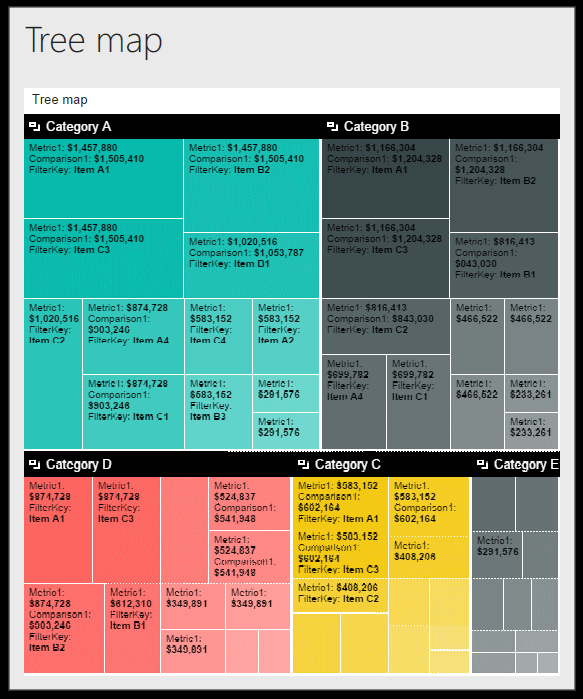
A Treemap chart is used to display hierarchical data and the configuration properties for the hierarchy are very simple and self-relevant. A Treemap chart is generally a better candidate for Tablet layouts than mobile layouts, and the amount of information displayed on this chart can make the visual too hard to analyze on a mobile screen. A Treemap would look like the image below on a tablet layout.
Waterfall Charts
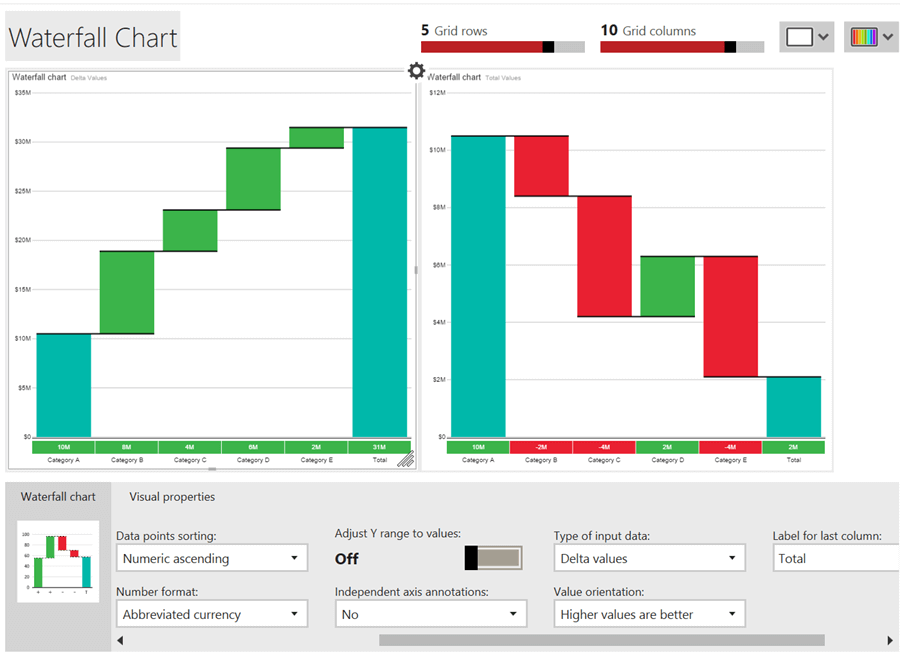
Waterfall charts are useful to understand how a total has been reached starting from an initial value. Depending upon data requirements, the data can be represented either as delta values or as total values. Both are shown below, the left chart is configured to show delta values and the right chart shows total values for the same data.
Charts help to display a lot of information through graphical means and uses very limited screen space to display the results.
Additional Information
- Considering reading more about charts here.
- Try to work with each chart using the default sample data and explore each property one by one.
