The first time a user sees the following message, the result of an unhandled deadlock error in SQL Server, it can come as quite a shock.
Msg 1205, Level 13, State 56, Line 10
Transaction (Process ID 62) was deadlocked on lock resources with another process and has been chosen as the deadlock victim. Rerun the transaction.
Two or more sessions were waiting to acquire a lock on a resource already locked by another session in the same locking chain. The result is a 'circular chain' where no session can complete, and so SQL Server is forced to intervene to clear up the mess. It automatically chooses one of the sessions as the 'victim', kills it and rolls back its transaction. It means that the other sessions may proceed, but that is little comfort to the hapless victim, and if that victim happens to be a session running a critical business process, then it may soon be of little comfort to the DBA.
Ideally, no user should ever be confronted with error message 1205, even if a deadlock does occur. Any application code that issues database queries should be equipped with error handling that deals with the problem gracefully, and sends the calling client a "user friendly" message. It should also have retry logic that allows the victim transaction to rerun, once the deadlock clears.
Nevertheless, deadlock errors cause resource contention, disruption and delay, and cannot be ignored. DBAs must know immediately when one occurs, by alerting on 1205 errors, and then need at their fingertips all of the information necessary to troubleshoot the deadlock and ensure that it doesn't recur.
If you suspect deadlocks are occurring on your SQL Server instances, what can you do? We'll review three approaches to their detection and resolution, each of which involves retrieving from SQL Server the information describing the deadlock, namely the deadlock graph. This reveals the deadlocked sessions, what statements were being run, the database, objects and pages on which the sessions were deadlocked, and more.
There was a time, when they only way to get the deadlock graph was to enable traceflag 1222 (or 1204 on SQL 2000) to capture it into the error log. Figure 1 shows the error log contents, highlighting the process selected as the deadlock victim then above it the deadlock graph output.
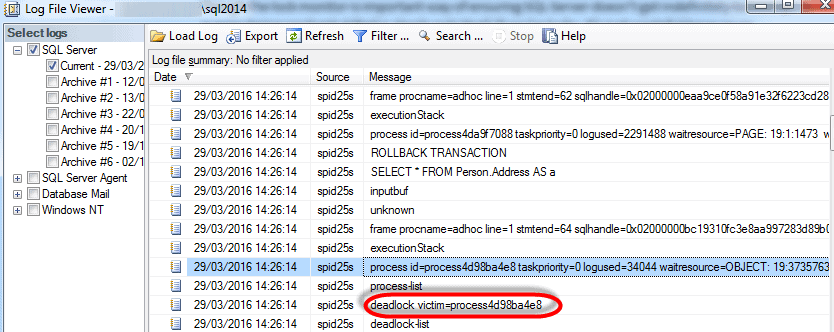
Figure 1 – the error log, with the victim of a deadlocked process highlighted in red
However, unless you have the traceflag enabled permanently, you'd need to enable it and wait for the deadlock to recur. As you can see, SQL Server fills the error log with a lot of information, and there is also a lot of manual work for the DBA still to do here, in working out the sessions and resources (tables, indexes) involved in the deadlock. Only use this technique if you have no other choice. With SQL Server 2008 and later there are much better ways.
On SQL Server 2008 or later, the system_health extended event session is enabled by default, and automatically captures the deadlock graph. You can retrieve it retrospectively, in response to a 1205 error alert, either by running a T-SQL/XPath query (e.g. see Listing 1 of Gail Shaw's article), or using the Extended Events UI target data viewer in SSMS (SQL Server 2012 and later only), as shown in Figure 2.
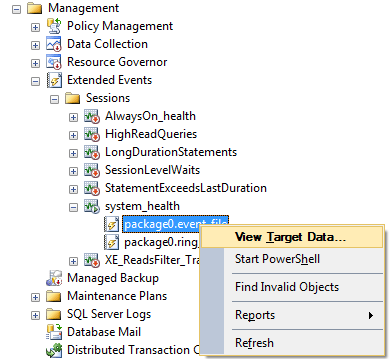
Figure 2 – View Target Data from the SQL Server Management Studio UI
There may be thousands of events displayed, but right-click on the data viewer and select Filter by this Value (or use the Extended Events | Filter menu) to set up a filter on the name column so the viewer displays an event only if it "Contains" the value "deadlock".
By clicking on an xml_deadlock_report event in the data viewer, we can see the deadlock graph, either as XML (Details tab) or in graphical form (Deadlock tab).
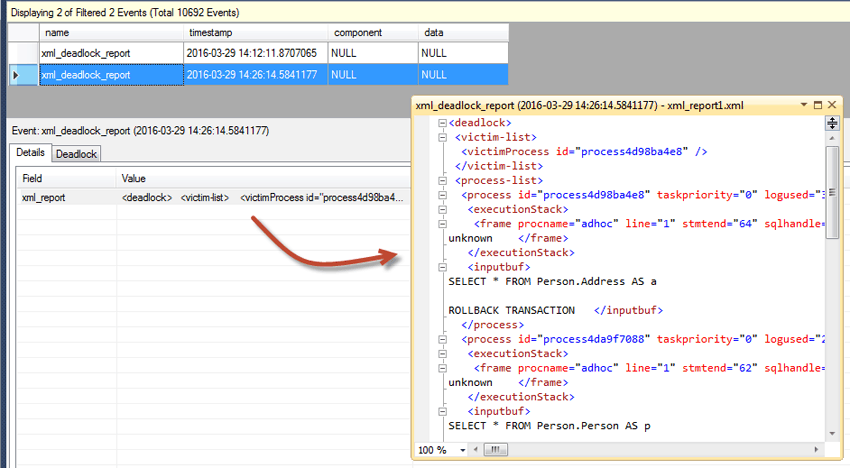
Figure 3 – an XML deadlock report
This approach is better than using traceflags but it still requires the DBA to be adept at reading XML deadlock graphs (the graphical output 'hides' too much information), and it still misses the full picture of what was happening on the server at the time the deadlock occurred. Was the problem exacerbated because the server under CPU or IO or memory pressure at the time? What other concurrent activity was occurring on the server?
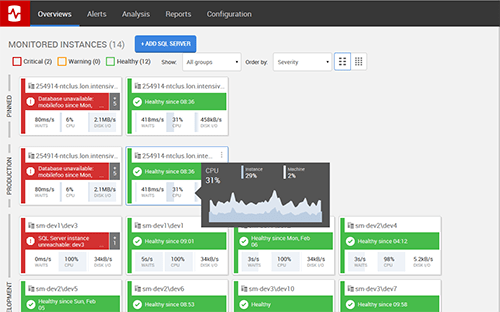
A SQL Server performance monitoring tool such as Redgate Monitor aims to give the DBA enough information to resolve a deadlock, without wading too deep into an XML deadlock graph, and places this information within the context of the overall pattern of activity on the server at the time. Not only does this ease the process of troubleshooting the deadlock, it also makes performance troubleshooting overall much more effective.
It detects a deadlock automatically and raises an alert, emailed to your inbox. The top half of the Details tab, on the alert screen in Redgate Monitor, presents in a digestible form the sessions, queries and database objects involved in the deadlock.
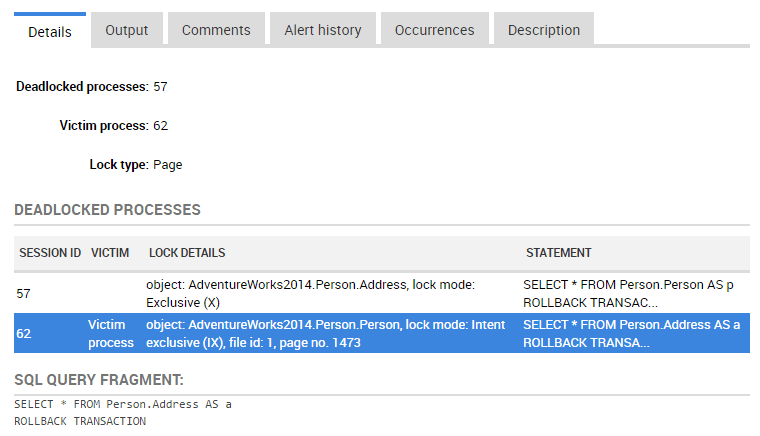
Figure 4 – a deadlocked process in Redgate Monitor, Redgate's SQL Server performance monitoring tool
This example demonstrates a classic reader-writer deadlock, most often seen when we have code that has data modifications followed by a SELECT query, within an explicit transaction. Session 57 obtains an exclusive (X) lock on the Person.Address table, to update it, then reads from Person.Person. Session 62 obtains an X lock on the Person.Person table, to update it, then reads from Person.Address. Session 57's SELECT can't proceed because of 62's X lock, and session 62's SELECT can't proceed because of 57's X lock. This is the deadly embrace known as a deadlock; session 62 becomes the victim.
This may well be all the information you need, but the Output tab of this screen still reveals the full XML deadlock graph, if required.
As well as seeing information about the processes involved, Redgate Monitor provides context about what was going on at that point in time. The lower half of the screen shows performance counter data, running machine processes and their resource consumption, expensive queries, as well as the waits relating to them. The line on the graphs indicates the time the deadlock occurred.
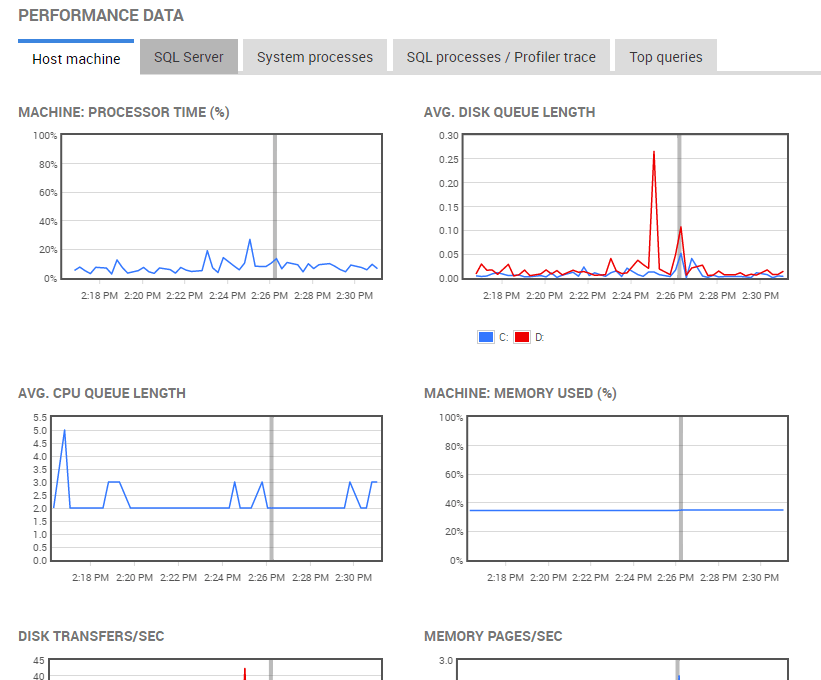
Figure 5 – Redgate Monitor's performance data graphs
The Top queries tab will reveal the plan handle for the statements involved in the deadlock, so you can retrieve their execution plans, should query tuning be required in order to resolve the problem (which it often is!).
Possible solutions in this case include rewriting the transactions so that they access tables in the same order, or perhaps running the transactions using either the READ COMMITTED SNAPSHOT or SNAPSHOT isolation level, where readers don't take Shared locks.
Checking error logs for deadlock information is an outdated and time-consuming way to troubleshoot the problem. A tool such as Extended Events can help the DBA resolve deadlocks, but it still requires additional work to set up alerting, as well as a series of other SQL Server performance monitoring resources and reports to gather the required performance metrics.
A SQL Server performance monitoring tool like Redgate Monitor enables a DBA to shift focus from diagnostic data collection and management to problem-solving based on alerts that supply sufficient information to resolve the deadlock quickly, and offer a richer understanding of server activity at the time of the problem.
That's where Redgate Monitor steps in with clear insights into SQL Server performance in real time, bringing problems to your attention before anyone else notices.
With its embedded expertise from SQL Server experts and MVPs, it gives you the data and advice you need to find and fix issues before users are even aware.
So, whether you're looking for baselining, wait stats, expensive queries, or instant alerts, find out how Redgate Monitor gives you everything you need – and more – with a free 14 day trial.
Learn more