When attempting to diagnose poor performance in SQL Server, it's a mistake to leap to conclusions regarding the root cause, based on any single piece of diagnostic data, such as CPU usage, or SQL Server disk IO capacity. In fact, using a single metric will often lead to an incorrect diagnosis of a problem.
Complex interdependencies exist between patterns of CPU, IO, and memory use in SQL Server, and we need to see the full picture before taking 'knee-jerk' corrective action, such as adding more memory, or more disk throughput capacity, or changing configuration settings.
"Process X is running slow. Can you fix it?"
As the DBA, you decide to spin up Windows Resource Monitor and immediately notice an abnormal pattern of disk activity on the server.
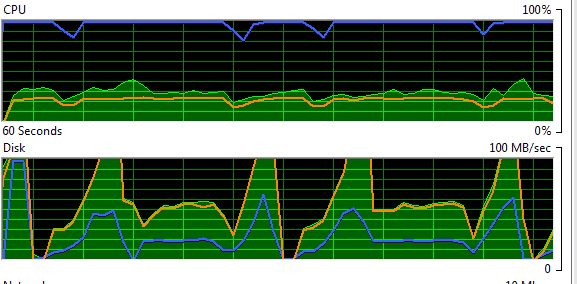
Figure 1 – Windows Resource Monitor showing an unusual patttern of disk activity on the server
Concerned to see the disk subsystem spiking to maximum capacity, you take a snapshot view of some disk-related counters in Performance Monitor (PerfMon).
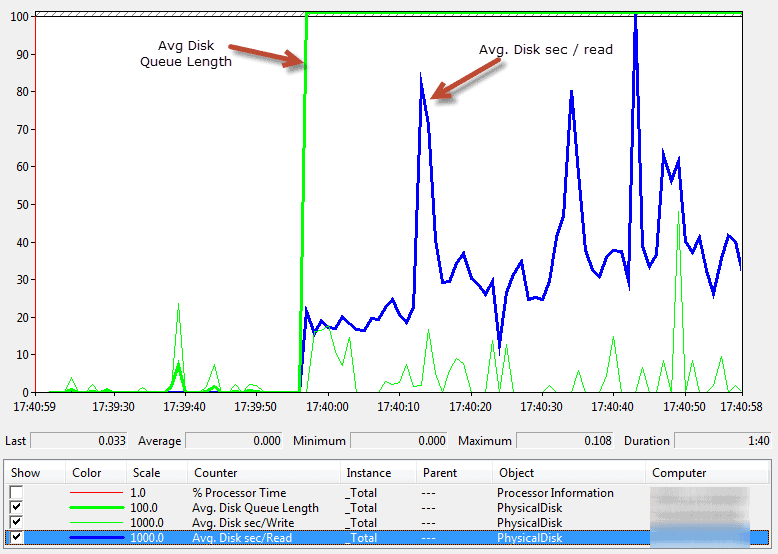
Figure 2 – Average Disk Queue Length and sec/Read in SQL Server Performance Monitor
It suggests periods of high latency associated with reading data from disk, accompanied by a sharp rise in the average disk queue length. It seems that the disk subsystem is becoming a bottleneck; it is struggling to keep up with the number of requests, SQL Server disk IO performance is deteriorating, and queues are forming.
What action should you take to resolve the problem? Before you contact your system administrator to see if there is anything to be done to increase disk capacity, it's wise to drill deeper.
If you focus on only one particular performance metric, then it is easy to misdiagnose SQL Server performance problems. You may have evidence that a particular bottleneck exists, in this case SQL Server disk IO, but it's dangerous to conclude that inadequate capacity or configuration of the disk subsystem is the cause of the problem. The excessive disk IO could easily have its root cause elsewhere. You need to collect further data that will confirm the cause of the problem. But where do you start?
A good place to start is with an analysis of SQL Server wait statistics, indicating the most prevalent reasons why SQL Server sessions were forced to pause processing (wait) before gaining access to a resource required to fulfill the request. By analyzing the waits, we can identify the resources that are main causes of contention and queues on a busy server.

This free eBook, by Jonathan Kehayias and Erin Stellato, provides an excellent overview of wait statistics, and good descriptions of some of the most common wait types, including those covered in this article.
Querying the sys.dm_os_waiting_tasks dynamic management view (DMV) reveals any currently-executing requests that are waiting for resources, joining to other DMVs for details of the associated sessions and requests, as demonstrated, for example, by Pinal Dave. In this example, we see two wait types, plus the query text and plans for the associated requests.

Figure 3 – the ASYNC_NETWORK_IO and PAGEIOLATCH waits
Of course, we are often investigating a problem retrospectively, in which case this DMV is no use to us. Instead, we can interrogate the sys.dm_os_wait_stats DMV, which contains "running totals" for all wait types, accumulated across all requests since the server was last restarted, or the statistics were manually reset using the DBCC SQLPERF command. Paul Randal maintains a useful query that omits many of the benign wait types. Figure 4 shows the output for this example.
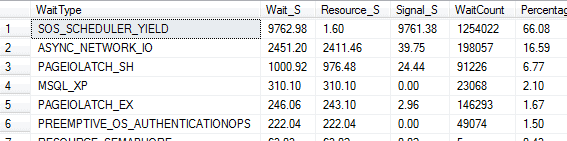
Figure 4 – a list of wait types accumulated across all requests since our server was last reset
The two wait types experienced by current queries, ASYNC_NETWORK_IO and PAGEIOLATCH_SH (Figure 3) also appear high in this historical list, along with others. If the problem under investigation isn't a recurring or long-standing issue, then it's possible that the relevant wait types will be "drowned out" among the historic waits. This is why it's important to maintain baselines for these wait statistics (as outlined in the above-referenced eBook).
The ASYNC_NETWORK_IO wait type is a network-related wait, often an indicator that the client cannot process the data quickly enough (the queries used in the example run repeatedly and send a lot of data to SSMS). In general, watch out for this wait type as a warning of inefficient data processing on the client-side.
More interesting in this case is the PAGEIOLATCH_SH wait type, meaning that read requests had to wait to obtain a latch, in order to read in from disk pages not held in the buffer cache. This may seem to reinforce our initial hunch that the problem in under-powered or misconfigured disks: if the disk subsystem cannot return pages quickly enough then it could lead to a long queue of requests waiting to obtain pages, and latch contention.
However, if we suspect a disk IO bottleneck, what is the root cause? A useful next step is to find out more about the IO workload. For example, are any databases and files particular "hotspots" of IO activity?
We can review the file usage statistics by interrogating the sys.dm_io_virtual_file_stats DMV, for example using a query such as the one provided by Glenn Berry (query #31). Figure 5 shows the output for this example.
The provides insight into IO activity on a SQL Server instance, and is especially useful for revealing the distribution of the IO load is distributed across the various databases.
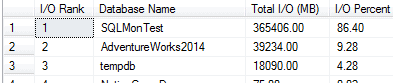
Figure 5 – results from the sys.dm_io_virtual_file_stats DMV
This indicates that the SQLMonTest database is an IO hotspot. Again, these statistics are accumulated since the last instance restart, but unlike wait statistics cannot be reset manually. Other similar queries (such as Listing 6 in the previously referenced eBook) might offer specific evidence of high read or write latency associated with particular databases. AdventureWorks2014 and SQLMonTest appear top of the list.
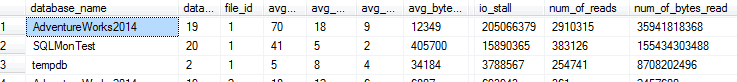
Figure 6 – the two databases that are IO hotspots
Having narrowed down the problem to one or two databases, the next logical question is: which requests are causing all this IO activity on these databases? We can examine the query execution statistics stored in sys.dm_exec_query_stats, to find, for example, the queries with the highest total physical reads, and their associated plan handles (some columns omitted from output), for a particular database.
	SELECT TOP 10
	        t.text ,
	        execution_count ,
	        statement_start_offset AS stmt_start_offset ,
	        sql_handle ,
	        plan_handle ,
	        total_logical_reads / execution_count AS avg_logical_reads ,
	        total_logical_writes / execution_count AS avg_logical_writes ,
	        total_physical_reads / execution_count AS avg_physical_reads
	FROM	sys.dm_exec_query_stats AS s
	        CROSS APPLY sys.dm_exec_sql_text(s.sql_handle) AS t
	WHERE	DB_NAME(t.dbid) = 'SQLMonTest'
	ORDER BY avg_physical_reads DESC;

Listing 1 – a query to retrieve execution statistics from sys.dm_exec_query_stats
We can query sys.dm_exec_query_plan using the plan handles from Listing 1, to return and review the execution plans for these queries, to see if there are potential issues with these queries.
Over the previous sections, we used various tools, views and queries to build up, piece by piece, a fuller picture of SQL Server activity, as we attempted to diagnose the root cause of a performance problem.
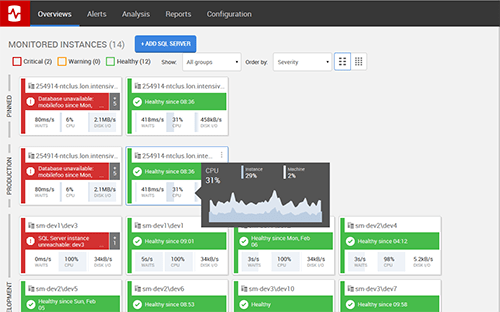
A tool such as Redgate Monitor attempts to pull together all of this useful data in one place. It raises alerts in response to certain errors, or abnormal conditions, in this case perhaps a "long running query alert", and provides as contextual information's all sorts of snapshots, aggregations, and summaries of resource usage and query activity on the server around the time of the alert, helping us to determine quickly what might have caused the problem.
For the same example, Redgate Monitor shows evidence of increased read latency, as we observed via PerfMon. However, it collects a wide range of other metrics, which we can plot on the same graph. Redgate Monitor pulls together into one place a lot of otherwise disparate information, allowing us to correlate variations and spikes in the use of various server resources, and relate them directly to the activity occurring on the server at that time.
Interestingly, at the exact time we see dramatic rises in disk IO latency, we also see a sustained drop in page life expectancy, which may indicate a period of memory pressure, where SQL Server was forced to flush pages from the cache to make room for other requested pages.
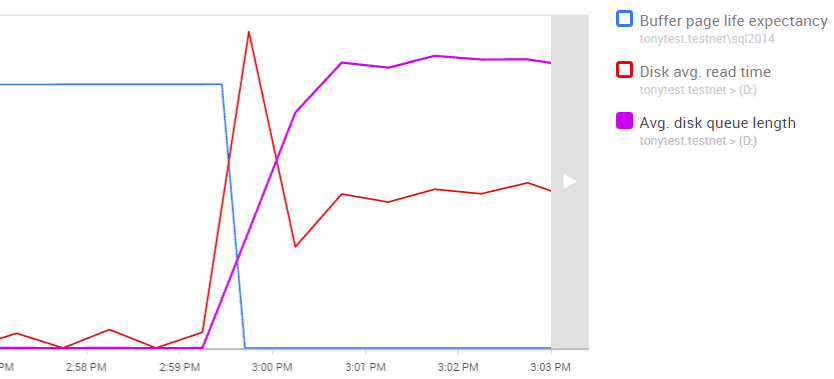
Figure 7 – Redgate Monitor's graph of Avg. disk queue length, read time, & buffer page life expectancy
So perhaps the problem is not the disk subsystem after all, but an undersized buffer pool, or simply just very inefficient queries requesting many pages that aren't in the buffer pool?
Redgate Monitor displays the top waits for the selected time period, showing the PAGEIOLATCH_SH and ASYNC_NETWORK_IO waits discussed earlier.
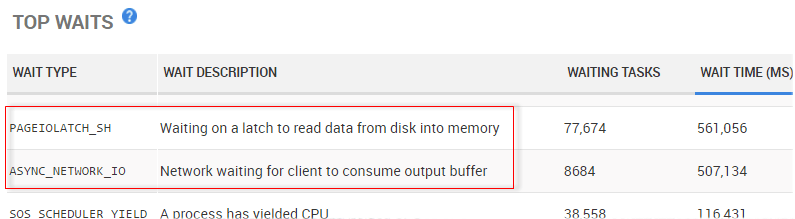
Figure 8 – Redgate Monitor's Top Waits list, showing PAGEIOLATCH_SH and ASYNC_NETWORK_IO
If we click on a wait type, we can see details of any significant queries associated with this wait. Using the manual methods described earlier in the article, matching which queries are responsible for which wait types can require a lot of detective work, and often a little guesswork. With Redgate Monitor, we can drill directly into a wait type and tie it to the queries largely responsible for those waits. It also removes the previous "since the last reset" caveats, since these Redgate Monitor statistics are unaffected by server restarts or manual resets.
Figure 9 shows the query associated with PAGEIOLATCH waits, which uses the SQLMonTest database.
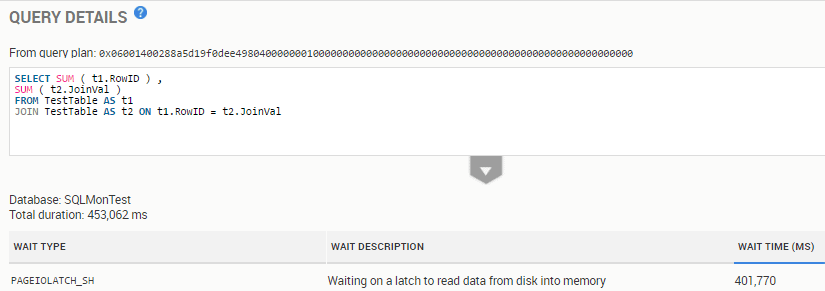
Figure 9 – an inefficient query associated with the PAGEIOLATCH_SH wait
We can also find details of top queries per database, along with their text, plan handles and associated waits, if we drill down to the database level metrics.
Examining the associated execution plan, for the query in Figure 9, we'd find unfiltered join conditions, very large table scans, and expensive join operations.
By reviewing all relevant performance metrics as a unit, we have the best chance of choosing the most effective course of action. In this case, it's clear that initial efforts should be directed towards query tuning as well as the indexing strategy, since we have queries with no WHERE filters, causing SQL Server to perform full table joins. The resulting excessive numbers of page reads is causing "cache churn" as SQL Server flushes buffer pages to disk in order to accommodate new pages, the consequence of which is a 'disk bottleneck', and sessions waiting to obtain buffer cache latches on pages that need to be read from disk.
That's where Redgate Monitor steps in with clear insights into SQL Server performance in real time, bringing problems to your attention before anyone else notices.
With its embedded expertise from SQL Server experts and MVPs, it gives you the data and advice you need to find and fix issues before users are even aware.
So, whether you're looking for baselining, wait stats, expensive queries, or instant alerts, find out how Redgate Monitor gives you everything you need – and more – with a free 14 day trial.
Learn more